PNC Bank 2009 Annual Report Download - page 39
Download and view the complete annual report
Please find page 39 of the 2009 PNC Bank annual report below. You can navigate through the pages in the report by either clicking on the pages listed below, or by using the keyword search tool below to find specific information within the annual report.-
 1
1 -
2
-
3
-
4
-
5
-
6
-
7
-
8
-
9
-
10
-
11
-
12
-
13
-
14
-
15
-
16
-
17
-
18
-
19
-
20
-
21
-
22
-
23
-
24
-
25
-
26
-
27
-
28
-
 29
29 -
 30
30 -
 31
31 -
 32
32 -
 33
33 -
 34
34 -
 35
35 -
 36
36 -
 37
37 -
 38
38 -
 39
39 -
 40
40 -
 41
41 -
 42
42 -
 43
43 -
 44
44 -
 45
45 -
 46
46 -
 47
47 -
 48
48 -
 49
49 -
50
-
51
-
52
-
53
-
54
-
55
-
56
-
57
-
58
-
59
-
60
-
61
-
62
-
63
-
64
-
65
-
66
-
67
-
68
-
69
-
70
-
71
-
72
-
73
-
74
-
75
-
76
-
77
-
78
-
79
-
80
-
81
-
82
-
83
-
84
-
85
-
86
-
87
-
88
-
89
-
90
-
91
-
92
-
93
-
94
-
95
-
96
-
97
-
98
-
99
-
100
-
101
-
102
-
103
-
104
-
105
-
106
-
107
-
108
-
109
-
110
-
111
-
112
-
113
-
114
-
115
-
116
-
117
-
118
-
119
-
120
-
121
-
122
-
123
-
124
-
125
-
126
-
127
-
128
-
129
-
130
-
131
-
132
-
133
-
134
-
135
-
136
-
137
-
138
-
139
-
140
-
141
-
142
-
143
-
144
-
145
-
146
-
147
-
148
-
149
-
150
-
151
-
152
-
153
-
154
-
155
-
156
-
157
-
158
-
159
-
160
-
161
-
162
-
163
-
164
-
165
-
166
-
167
-
168
-
169
-
170
-
171
-
172
-
173
-
174
-
175
-
176
-
177
-
178
-
179
-
180
-
181
-
182
-
183
-
184
-
185
-
186
-
187
-
188
-
189
-
190
-
191
-
192
-
193
-
194
-
195
-
196
 |
 |

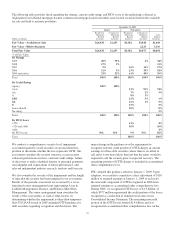
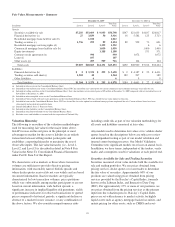
The following table provides detail regarding the vintage, current credit rating, and FICO score of the underlying collateral at
origination for residential mortgage-backed, commercial mortgage-backed and other asset-backed securities held in the available
for sale and held to maturity portfolios:
December 31, 2009
Agency Non-agency
Dollars in millions
Residential
Mortgage-
Backed
Securities
Commercial
Mortgage-
Backed
Securities
Residential
Mortgage-
Backed
Securities
Commercial
Mortgage-
Backed
Securities
Asset-
Backed
Securities
Fair Value – Available for Sale $24,438 $1,297 $8,302 $3,848 $1,668
Fair Value – Held to Maturity 2,225 3,136
Total Fair Value $24,438 $1,297 $8,302 $6,073 $4,804
% of Fair Value:
By Vintage
2009 40% 73% 2% 34%
2008 17% 2% 11%
2007 9% 16% 16% 17%
2006 11% 3% 23% 33% 18%
2005 and earlier 23% 22% 61% 49% 20%
Total 100% 100% 100% 100% 100%
By Credit Rating
Agency 100% 100%
AAA 12% 91% 74%
AA 7% 2% 5%
A8% 3%
BBB 12% 3% 1%
BB 16% 1% 5%
B15% 5%
Lower than B 30% 8%
No rating 2%
Total 100% 100% 100% 100% 100%
By FICO Score
>720 61% 4%
<720 and >660 30% 10%
<660 4%
No FICO score N/A N/A 9% N/A 82%
Total 100% 100%
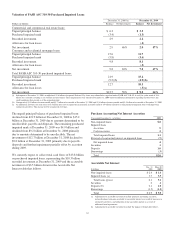
We conduct a comprehensive security-level impairment
assessment quarterly on all securities in an unrealized loss
position to determine whether the loss represents OTTI. Our
assessment considers the security structure, recent security
collateral performance metrics, external credit ratings, failure
of the issuer to make scheduled interest or principal payments,
our judgment and expectations of future performance, and
relevant independent industry research, analysis and forecasts.
We also consider the severity of the impairment and the length
of time that the security has been impaired in our assessment.
Results of the periodic assessment are reviewed by a cross-
functional senior management team representing Asset &
Liability Management, Finance, and Balance Sheet Risk
Management. The senior management team considers the
results of the assessments, as well as other factors, in
determining whether the impairment is other-than-temporary.
New US GAAP issued in 2009 amended OTTI guidance for
debt securities regarding recognition and disclosure. The
major change in the guidance was the requirement to
recognize only the credit portion of OTTI charges in current
earnings for those debt securities where there is no intent to
sell and it is not more likely than not that the entity would be
required to sell the security prior to expected recovery. The
remaining portion of OTTI charges is included in accumulated
other comprehensive loss.
PNC adopted this guidance effective January 1, 2009. Upon
adoption, we recorded a cumulative effect adjustment of $110
million to retained earnings at January 1, 2009 to reclassify
the noncredit component of OTTI recognized in 2008 from
retained earnings to accumulated other comprehensive loss.
During 2009, we recognized OTTI losses of $1.9 billion, of
which $577 million represented the credit portion of the losses
recognized as a reduction of noninterest income on our
Consolidated Income Statement. The remaining noncredit
portion of the OTTI losses totaled $1.4 billion and was
recognized in accumulated other comprehensive loss on the
35