PNC Bank 2009 Annual Report Download - page 55
Download and view the complete annual report
Please find page 55 of the 2009 PNC Bank annual report below. You can navigate through the pages in the report by either clicking on the pages listed below, or by using the keyword search tool below to find specific information within the annual report.-
 1
1 -
2
-
3
-
4
-
5
-
6
-
7
-
8
-
9
-
10
-
11
-
12
-
13
-
14
-
15
-
16
-
17
-
18
-
19
-
20
-
21
-
22
-
23
-
24
-
25
-
26
-
27
-
28
-
29
-
30
-
31
-
32
-
33
-
34
-
35
-
36
-
37
-
38
-
39
-
40
-
41
-
42
-
43
-
44
-
 45
45 -
 46
46 -
 47
47 -
 48
48 -
 49
49 -
 50
50 -
 51
51 -
 52
52 -
 53
53 -
 54
54 -
 55
55 -
 56
56 -
 57
57 -
 58
58 -
 59
59 -
 60
60 -
 61
61 -
 62
62 -
 63
63 -
 64
64 -
 65
65 -
66
-
67
-
68
-
69
-
70
-
71
-
72
-
73
-
74
-
75
-
76
-
77
-
78
-
79
-
80
-
81
-
82
-
83
-
84
-
85
-
86
-
87
-
88
-
89
-
90
-
91
-
92
-
93
-
94
-
95
-
96
-
97
-
98
-
99
-
100
-
101
-
102
-
103
-
104
-
105
-
106
-
107
-
108
-
109
-
110
-
111
-
112
-
113
-
114
-
115
-
116
-
117
-
118
-
119
-
120
-
121
-
122
-
123
-
124
-
125
-
126
-
127
-
128
-
129
-
130
-
131
-
132
-
133
-
134
-
135
-
136
-
137
-
138
-
139
-
140
-
141
-
142
-
143
-
144
-
145
-
146
-
147
-
148
-
149
-
150
-
151
-
152
-
153
-
154
-
155
-
156
-
157
-
158
-
159
-
160
-
161
-
162
-
163
-
164
-
165
-
166
-
167
-
168
-
169
-
170
-
171
-
172
-
173
-
174
-
175
-
176
-
177
-
178
-
179
-
180
-
181
-
182
-
183
-
184
-
185
-
186
-
187
-
188
-
189
-
190
-
191
-
192
-
193
-
194
-
195
-
196
 |
 |
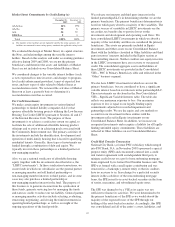
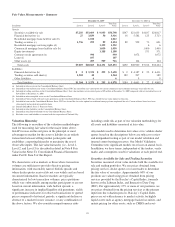
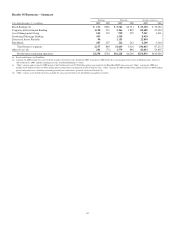
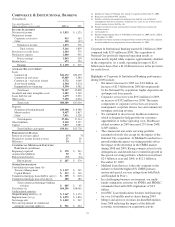
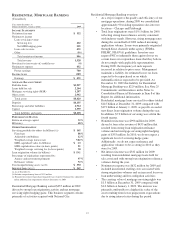
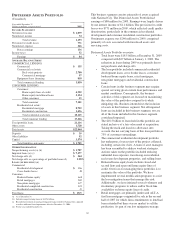
Highlights of Retail Banking’s performance for 2009:
• The acquisition of National City added
approximately $29 billion of loans and $81 billion of
deposits to Retail Banking. Other salient points
related to this acquisition include the following:
– Added over 1,400 branches,
– Expanded our ATMs by over 2,100 locations,
– Established or significantly increased our
branch presence in Ohio, Kentucky, Indiana,
Illinois, Pennsylvania, Michigan, Wisconsin,
Missouri and Florida – giving PNC one of the
largest branch distribution networks among
banks in the country,
– Expanded our customer base with the addition
of approximately 2.7 million checking
relationships, and
– Added $12 billion in brokerage account assets.
We successfully completed the required divestiture
of 61 branches and 73 ATMs from the National City
acquisition by early September and the first major
conversion of National City customers to the PNC
platform in November 2009, with three remaining
conversions on schedule to be completed by June
2010.
• Retail Banking expanded the number of customers it
serves and grew checking relationships. Excluding
relationships added from acquisitions and the impact
of the required divestitures, net new consumer and
business checking relationships for legacy PNC grew
by 119,000 since December 31, 2008 compared with
70,000 during the same period last year.
• Our investment in online banking capabilities
continued to pay off. Excluding customers added
from acquisitions and the impact of the required
divestitures, active online bill pay and active online
banking customers have increased 18% and 17%,
respectively, since December 31, 2008. We continue
to seek customer growth by expanding our use of
technology, such as our “Virtual Wallet” online
banking product. We leveraged our understanding of
this market along with our extensive university
banking program and launched a new product in the
second quarter of 2009 for college students and their
parents, called “Virtual Wallet Student.”
• Employee engagement and customer satisfaction/
loyalty results are tracking at all time highs. In 2009,
we received the “Gallup Great Workplace Award” in
recognition of our extraordinary ability to create an
engaged workplace culture.
• At December 31, 2009, Retail Banking had 2,512
branches and an ATM network of 6,473 machines
giving PNC one of the largest distribution networks
among US banks. We continued to invest in the
branch network, albeit at a slower pace than in prior
years given the current economic conditions. We are
optimizing our network by opening new branches in
high growth areas, relocating branches to areas of
higher market opportunity, and consolidating
branches in areas of declining opportunity. In 2009,
we opened 27 traditional branches and 45 in-store
branches, added 313 ATMs, and divested 61
branches and 73 ATMs. To continue to optimize our
network, we also consolidated 79 and relocated 11
branches in 2009. The in-store branches and the
ATMs were primarily opened under our previously
reported exclusive banking services agreement with
Giant Food LLC supermarkets.
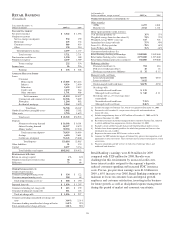
Total revenue for 2009 was $5.7 billion compared with $2.7
billion in 2008. Net interest income of $3.5 billion increased
$1.9 billion compared with 2008. The increase in net interest
income was driven by the National City acquisition and was
partially offset by declines in legacy net interest income as a
result of the negative impact of lower interest credits assigned
to the segment’s deposits in this low rate environment.
Noninterest income for 2009 was $2.2 billion, an increase of
$1.1 billion over the prior year. The National City acquisition
was the major factor for the increase, partially offset by a $95
million gain from the redemption of Visa common shares in
the first quarter of 2008. In addition, core growth in brokerage
account activities and consumer related fees have been
negatively impacted by current economic conditions. The
Market Risk Management – Equity and Other Investment Risk
section of this Item 7 includes further information regarding
our investment in Visa.
In 2010, Retail Banking revenue will be negatively impacted
in a more significant manner by 1) the new rules set forth in
Regulation E related to overdraft charges and 2) the Credit
CARD Act. Current estimates are that 2010 earnings will be
impacted by approximately $115 million related to Regulation
E and by approximately $40 million attributable to the Credit
CARD Act. These estimates do not include any additional
negative impact to revenue for other changes that may be
made in 2010 responding to market conditions or other/
additional regulatory requirements, or any offsetting impact of
changes to products and/or pricing.
In 2009, the provision for credit losses was $1.3 billion
compared with $388 million in 2008. Net charge-offs were
$1.0 billion for 2009 and $257 million last year. The increases
in provision and net charge-offs were primarily a result of a
loan portfolio that has increased 117%, including a
significantly larger credit card portfolio, and the continued
credit deterioration in both the commercial and consumer loan
portfolios which has required an increase to loan loss reserves.
Noninterest expense for 2009 totaled $4.2 billion, an increase
of $2.4 billion over last year. The increase was primarily
attributable to the impact of acquisitions, as well as increased
FDIC insurance costs and continued investments in the
business.
Growing core checking deposits as a lower-cost funding
source and as the cornerstone product to build customer
51