PNC Bank 2009 Annual Report Download - page 72
Download and view the complete annual report
Please find page 72 of the 2009 PNC Bank annual report below. You can navigate through the pages in the report by either clicking on the pages listed below, or by using the keyword search tool below to find specific information within the annual report.-
 1
1 -
2
-
3
-
4
-
5
-
6
-
7
-
8
-
9
-
10
-
11
-
12
-
13
-
14
-
15
-
16
-
17
-
18
-
19
-
20
-
21
-
22
-
23
-
24
-
25
-
26
-
27
-
28
-
29
-
30
-
31
-
32
-
33
-
34
-
35
-
36
-
37
-
38
-
39
-
40
-
41
-
42
-
43
-
44
-
45
-
46
-
47
-
48
-
49
-
50
-
51
-
52
-
53
-
54
-
55
-
56
-
57
-
58
-
59
-
60
-
61
-
 62
62 -
 63
63 -
 64
64 -
 65
65 -
 66
66 -
 67
67 -
 68
68 -
 69
69 -
 70
70 -
 71
71 -
 72
72 -
 73
73 -
 74
74 -
 75
75 -
 76
76 -
 77
77 -
 78
78 -
 79
79 -
 80
80 -
 81
81 -
 82
82 -
83
-
84
-
85
-
86
-
87
-
88
-
89
-
90
-
91
-
92
-
93
-
94
-
95
-
96
-
97
-
98
-
99
-
100
-
101
-
102
-
103
-
104
-
105
-
106
-
107
-
108
-
109
-
110
-
111
-
112
-
113
-
114
-
115
-
116
-
117
-
118
-
119
-
120
-
121
-
122
-
123
-
124
-
125
-
126
-
127
-
128
-
129
-
130
-
131
-
132
-
133
-
134
-
135
-
136
-
137
-
138
-
139
-
140
-
141
-
142
-
143
-
144
-
145
-
146
-
147
-
148
-
149
-
150
-
151
-
152
-
153
-
154
-
155
-
156
-
157
-
158
-
159
-
160
-
161
-
162
-
163
-
164
-
165
-
166
-
167
-
168
-
169
-
170
-
171
-
172
-
173
-
174
-
175
-
176
-
177
-
178
-
179
-
180
-
181
-
182
-
183
-
184
-
185
-
186
-
187
-
188
-
189
-
190
-
191
-
192
-
193
-
194
-
195
-
196
 |
 |

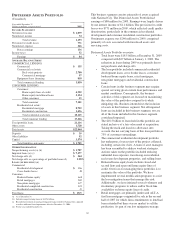
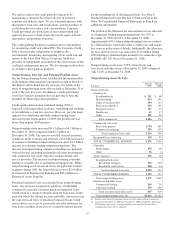
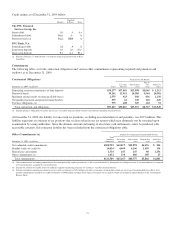
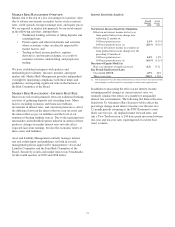
Change In Nonperforming Assets
In millions 2009 2008
January 1 $ 2,181 $ 495
Transferred from accrual 8,501 1,981
Charge-offs and valuation adjustments (1,770) (491)
Principal activity including payoffs (1,127) (381)
Asset sales (798) (43)
Returned to performing (671) (127)
National City acquisition 738
Sterling acquisition 9
December 31 $ 6,316 $2,181
Total nonperforming loans and nonperforming assets in the
tables above are significantly lower than they would have
been otherwise due to the accounting treatment for purchased
impaired loans. This treatment also results in lower ratios of
nonperforming loans to total loans and allowance for loan and
lease losses to nonperforming loans. We recorded such loans
at estimated fair value of $12.7 billion at December 31, 2008,
including an impairment mark for life of loan credit losses.
These loans are considered performing, even if contractually
past due (or if we do not expect to receive payment in full
based on the original contractual terms), as we are currently
accreting interest income over the expected life of the loans.
The accretable interest/yield represents the excess of expected
cash flows on the loans at the measurement date over the
recorded investment. See Note 6 Purchased Impaired Loans
Related to National City in the Notes To Consolidated
Financial Statements in Item 8 of this Report for additional
information on those loans.
At December 31, 2009, our largest nonperforming asset was
approximately $49 million and our average nonperforming
loan associated with commercial lending was approximately
$1 million.
The amount of nonperforming loans that were current as to
principal and interest was $1.7 billion at December 31, 2009
and $555 million at December 31, 2008.
Loans whose contractual terms have been restructured in a
manner which grants a concession to a borrower experiencing
financial difficulties where we do not receive adequate
compensation are considered troubled debt restructurings.
Troubled debt restructurings typically result from our loss
mitigation activities and could include rate reductions,
principal forgiveness, forbearance and other actions intended
to minimize the economic loss and to avoid foreclosure or
repossession of collateral. Troubled debt restructurings
completed during 2009 and included in nonperforming loans
totaled $440 million at December 31, 2009. Purchased
impaired loans are excluded from troubled debt restructurings.
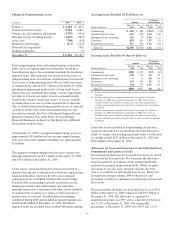
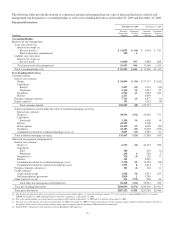
Accruing Loans Past Due 30 To 89 Days (a)
Amount
Percent of
Outstandings
Dollars in millions
Dec. 31
2009
Dec. 31
2008
Dec. 31
2009
Dec. 31
2008
Commercial $ 684 $ 489 1.26% .72%
Commercial real estate 666 400 3.10 1.68
Equipment lease financing 128 74 2.06 1.15
Consumer 438 451 .87 .93
Residential real estate 472 506 3.12 3.23
Total (b) $2,388 $1,920 1.62 1.18
Accruing Loans Past Due 90 Days Or More (a)
Amount
Percent of
Outstandings
Dollars in millions
Dec. 31
2009
Dec. 31
2008
Dec. 31
2009
Dec. 31
2008
Commercial $188 $90 .35% .13%
Commercial real estate 150 52 .70 .22
Equipment lease financing 62.10 .03
Consumer 226 154 .45 .32
Residential real estate 314 97 2.07 .62
Total (c) $884 $395 .60 .24
(a) Excludes loans that are government insured/guaranteed, primarily residential
mortgages.
(b) Excludes impaired loans acquired from National City totaling $.8 billion at
December 31, 2009 and $1.6 billion at December 31, 2008. These loans are
excluded as they were recorded at estimated fair value when acquired and are
currently considered performing loans due to the accretion of interest in purchase
accounting.
(c) Excludes impaired loans acquired from National City totaling $2.7 billion at
December 31, 2009 and $2.0 billion at December 31, 2008. These loans are
excluded as they were recorded at estimated fair value when acquired and are
currently considered performing loans due to the accretion of interest in purchase
accounting.
Loans that are not included in nonperforming or past due
categories and which we are uncertain about the borrower’s
ability to comply with existing repayment terms over the next
six months totaled $811 million at December 31, 2009 and
$745 million at December 31, 2008.
Allowances for Loan and Lease Losses and Unfunded Loan
Commitments and Letters of Credit
We maintain an allowance for loan and lease losses to absorb
losses from the loan portfolio. We determine the allowance
based on quarterly assessments of the estimated probable
credit losses incurred in the loan portfolio. While we make
allocations to specific loans and pools of loans, the total
reserve is available for all loan and lease losses. There were
no significant changes during 2009 to the process and
procedures we follow to determine our allowance of loan and
lease losses.
We increased the allowance for loan and lease losses to $5.1
billion at December 31, 2009 compared with $3.9 billion at
December 31, 2008. The allowance as a percent of
nonperforming loans was 89% and as a percent of total loans
was 3.22% at December 31, 2009. The comparable
percentages at December 31, 2008 were 236% and 2.23%.
68