PNC Bank 2009 Annual Report Download - page 143
Download and view the complete annual report
Please find page 143 of the 2009 PNC Bank annual report below. You can navigate through the pages in the report by either clicking on the pages listed below, or by using the keyword search tool below to find specific information within the annual report.-
 1
1 -
2
-
3
-
4
-
5
-
6
-
7
-
8
-
9
-
10
-
11
-
12
-
13
-
14
-
15
-
16
-
17
-
18
-
19
-
20
-
21
-
22
-
23
-
24
-
25
-
26
-
27
-
28
-
29
-
30
-
31
-
32
-
33
-
34
-
35
-
36
-
37
-
38
-
39
-
40
-
41
-
42
-
43
-
44
-
45
-
46
-
47
-
48
-
49
-
50
-
51
-
52
-
53
-
54
-
55
-
56
-
57
-
58
-
59
-
60
-
61
-
62
-
63
-
64
-
65
-
66
-
67
-
68
-
69
-
70
-
71
-
72
-
73
-
74
-
75
-
76
-
77
-
78
-
79
-
80
-
81
-
82
-
83
-
84
-
85
-
86
-
87
-
88
-
89
-
90
-
91
-
92
-
93
-
94
-
95
-
96
-
97
-
98
-
99
-
100
-
101
-
102
-
103
-
104
-
105
-
106
-
107
-
108
-
109
-
110
-
111
-
112
-
113
-
114
-
115
-
116
-
117
-
118
-
119
-
120
-
121
-
122
-
123
-
124
-
125
-
126
-
127
-
128
-
129
-
130
-
131
-
132
-
 133
133 -
 134
134 -
 135
135 -
 136
136 -
 137
137 -
 138
138 -
 139
139 -
 140
140 -
 141
141 -
 142
142 -
 143
143 -
 144
144 -
 145
145 -
 146
146 -
 147
147 -
 148
148 -
 149
149 -
 150
150 -
 151
151 -
 152
152 -
 153
153 -
154
-
155
-
156
-
157
-
158
-
159
-
160
-
161
-
162
-
163
-
164
-
165
-
166
-
167
-
168
-
169
-
170
-
171
-
172
-
173
-
174
-
175
-
176
-
177
-
178
-
179
-
180
-
181
-
182
-
183
-
184
-
185
-
186
-
187
-
188
-
189
-
190
-
191
-
192
-
193
-
194
-
195
-
196
 |
 |

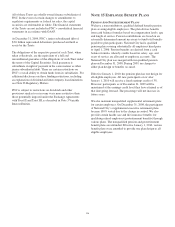
The guidelines also indicate which investments and strategies
the manager is permitted to use to achieve its performance
objectives, and which investments and strategies it is
prohibited from using.
Where public market investment strategies may include the
use of derivatives and/or currency management, language is
incorporated in the managers’ guidelines to define allowable
and prohibited transactions and/or strategies. Derivatives are
typically employed by investment managers to modify risk/
return characteristics of their portfolio(s), implement asset
allocation changes in a cost-effective manner, or reduce
transaction costs. Under the managers’ investment guidelines,
derivatives may not be used solely for speculation or leverage.
Derivatives are used only in circumstances where they offer
the most efficient economic means of improving the risk/
reward profile of the portfolio.
BlackRock and the Asset Management Group business
segment receive compensation for providing investment
management and trustee services for the majority of the Trust
portfolio. Compensation for such services is paid by PNC.
Non-affiliate service providers for the Trust are compensated
from plan assets.
F
AIR
V
ALUE
M
EASUREMENTS
Effective January 1, 2008, the PNC Pension Plan adopted fair
value measurements and disclosures.
As further described in Note 8 Fair Value, GAAP establishes
the framework for measuring fair value, including a hierarchy
used to classify the inputs used in measuring fair value.
A description of the valuation methodologies used for assets
measured at fair value follows. There have been no changes in
the methodologies used at December 31, 2009 compared with
those in place at December 31, 2008:
• Money market, mutual funds and interests in
collective funds are valued at the net asset value of
the shares held by the pension plan at year-end.
• US government securities, other government
securities, corporate debt, common stock and
preferred stock are valued at the closing price
reported on the active market on which the individual
securities are traded.
• Limited partnerships are valued by investment
managers based on recent financial information used
to estimate fair value. Other investments held by the
pension plan include derivative financial instruments
and real estate, which are recorded at estimated fair
value as determined by third-party appraisals and
pricing models, and group annuity contracts which
are valued at fair value by discounting the related
cash flows based on current yields of similar
instruments with comparable durations considering
the credit-worthiness of the issuer.
These methods may result in fair value calculations that may
not be indicative of net realizable values or future fair values.
Furthermore, while the pension plan believes its valuation
methods are appropriate and consistent with other market
participants, the use of different methodologies or
assumptions to determine the fair value of certain financial
instruments could result in a different fair value measurement
at the reporting date.
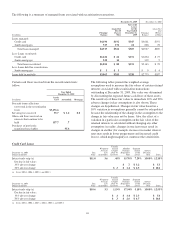
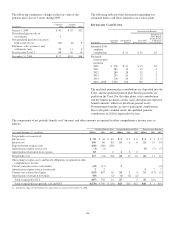
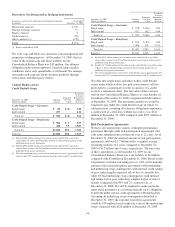
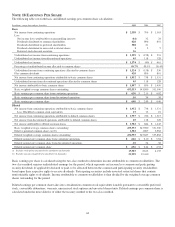
The following table sets forth by level, within the fair value hierarchy, the Plan’s assets at fair value as of December 31, 2009:
Fair Value Measurements Using:
In millions
December 31, 2009
Fair Value
Quoted Prices in
Active Markets
For Identical
Assets
(Level 1)
Significant
Other
Observable
Inputs
(Level 2)
Significant
Unobservable
Inputs
(Level 3)
Cash $2 $2
Money market funds 334 285 $ 49
US government securities 200 73 127
Corporate debt 522 1 404 $117
Common and preferred stocks 498 198 300
Mutual funds 46 11 35
Interest in Collective Funds (a) 1,948 1,948
Limited partnerships 119 119
Other 52 844
Total $3,721 $578 $2,863 $280
(a) The benefit plans own commingled funds that invest in equity and fixed income securities. The commingled funds that invest
in equity securities seek to mirror the performance of the S&P 500 Index, Russell 3000 Index, Morgan Stanley Capital
International ACWI X US Index, and the Dow Jones U.S. Select Real Estate Securities Index. The commingled fund that
holds fixed income securities invests in domestic investment grade securities and seeks to mimic the performance of the
Barclays Aggregate Bond Index.
139