PNC Bank 2009 Annual Report Download - page 169
Download and view the complete annual report
Please find page 169 of the 2009 PNC Bank annual report below. You can navigate through the pages in the report by either clicking on the pages listed below, or by using the keyword search tool below to find specific information within the annual report.-
 1
1 -
2
-
3
-
4
-
5
-
6
-
7
-
8
-
9
-
10
-
11
-
12
-
13
-
14
-
15
-
16
-
17
-
18
-
19
-
20
-
21
-
22
-
23
-
24
-
25
-
26
-
27
-
28
-
29
-
30
-
31
-
32
-
33
-
34
-
35
-
36
-
37
-
38
-
39
-
40
-
41
-
42
-
43
-
44
-
45
-
46
-
47
-
48
-
49
-
50
-
51
-
52
-
53
-
54
-
55
-
56
-
57
-
58
-
59
-
60
-
61
-
62
-
63
-
64
-
65
-
66
-
67
-
68
-
69
-
70
-
71
-
72
-
73
-
74
-
75
-
76
-
77
-
78
-
79
-
80
-
81
-
82
-
83
-
84
-
85
-
86
-
87
-
88
-
89
-
90
-
91
-
92
-
93
-
94
-
95
-
96
-
97
-
98
-
99
-
100
-
101
-
102
-
103
-
104
-
105
-
106
-
107
-
108
-
109
-
110
-
111
-
112
-
113
-
114
-
115
-
116
-
117
-
118
-
119
-
120
-
121
-
122
-
123
-
124
-
125
-
126
-
127
-
128
-
129
-
130
-
131
-
132
-
133
-
134
-
135
-
136
-
137
-
138
-
139
-
140
-
141
-
142
-
143
-
144
-
145
-
146
-
147
-
148
-
149
-
150
-
151
-
152
-
153
-
154
-
155
-
156
-
157
-
158
-
 159
159 -
 160
160 -
 161
161 -
 162
162 -
 163
163 -
 164
164 -
 165
165 -
 166
166 -
 167
167 -
 168
168 -
 169
169 -
 170
170 -
 171
171 -
 172
172 -
 173
173 -
 174
174 -
 175
175 -
 176
176 -
 177
177 -
 178
178 -
 179
179 -
180
-
181
-
182
-
183
-
184
-
185
-
186
-
187
-
188
-
189
-
190
-
191
-
192
-
193
-
194
-
195
-
196
 |
 |

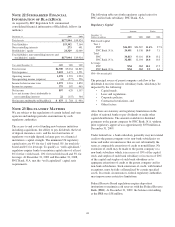
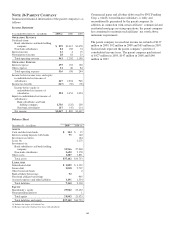
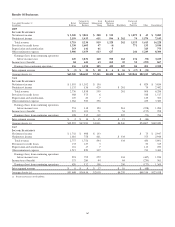
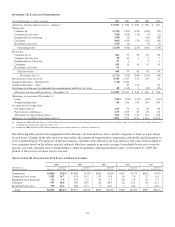
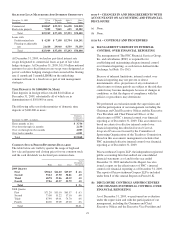
Statement Of Cash Flows
Year ended December 31 - in millions 2009 2008 2007
O
PERATING
A
CTIVITIES
Net income $ 2,447 $ 882 $ 1,467
Adjustments to reconcile net income
to net cash provided (used) by
operating activities:
Equity in undistributed net
(earnings) of subsidiaries (1,853) 172 (443)
Other 2,687 156 61
Net cash provided by operating
activities 3,281 1,210 1,085
I
NVESTING
A
CTIVITIES
Net capital returned from
(contributed to) subsidiaries (899) (8,298) (165)
Investment securities:
Sales and maturities 267 1,090
Purchases (228) (800)
Net cash received from (paid for)
acquisitions 51,431 (2,212)
Other (182) (104) (45)
Net cash used in investing
activities (1,037) (6,971) (2,132)
F
INANCING
A
CTIVITIES
Borrowings from non-bank
subsidiary 3,420 2,100 3,910
Repayments on borrowings from
non-bank subsidiary (4,274) (3,633) (1,432)
Other borrowed funds (1,166) 103
Preferred stock – TARP 7,275
Preferred stock – other 492
TARP warrant 304
Supervisory Capital Assessment
Program – common stock 624
Common and treasury stock 247 375 253
Acquisition of treasury stock (188) (234) (963)
Preferred stock cash dividends paid (388) (21)
Common stock cash dividends paid (430) (902) (806)
Net cash provided by (used in)
financing activities (2,155) 5,756 1,065
Increase (decrease) in cash and due
from banks 89 (5) 18
Cash and due from banks at
beginning of year 15 20 2
Cash and due from banks at
end of year $ 104 $15$20
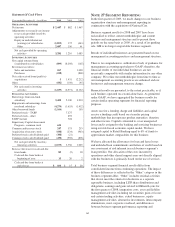
N
OTE
27 S
EGMENT
R
EPORTING
In the first quarter of 2009, we made changes to our business
organization structure and management reporting in
conjunction with the acquisition of National City.
Business segment results for 2008 and 2007 have been
reclassified to reflect current methodologies and current
business and management structure and to present those
periods on the same basis as 2009. As a result of its pending
sale, GIS is no longer a reportable business segment.
Results of individual businesses are presented based on our
management accounting practices and management structure.
There is no comprehensive, authoritative body of guidance for
management accounting equivalent to GAAP; therefore, the
financial results of our individual businesses are not
necessarily comparable with similar information for any other
company. We refine our methodologies from time to time as
our management accounting practices are enhanced and our
businesses and management structure change.
Financial results are presented, to the extent practicable, as if
each business operated on a stand-alone basis. As permitted
under GAAP, we have aggregated the business results for
certain similar operating segments for financial reporting
purposes.
Assets receive a funding charge and liabilities and capital
receive a funding credit based on a transfer pricing
methodology that incorporates product maturities, duration
and other factors. Capital is intended to cover unexpected
losses and is assigned to the banking and servicing businesses
using our risk-based economic capital model. We have
assigned capital to Retail Banking equal to 6% of funds to
approximate market comparables for this business.
We have allocated the allowances for loan and lease losses
and unfunded loan commitments and letters of credit based on
our assessment of risk inherent in each business segment’s
loan portfolio. Our allocation of the costs incurred by
operations and other shared support areas not directly aligned
with the businesses is primarily based on the use of services.
Total business segment financial results differ from
consolidated income from continuing operations. The impact
of these differences is reflected in the “Other” category in the
business segment tables. “Other” includes residual activities
that do not meet the criteria for disclosure as a separate
reportable business, including LTIP share distributions and
obligations, earnings and gains related to Hilliard Lyons for
the first quarter of 2008, integration costs, asset and liability
management activities including net securities gains or losses
and certain trading activities, exited businesses, equity
management activities, alternative investments, intercompany
eliminations, most corporate overhead, and differences
between business segment performance reporting and
165