PNC Bank 2009 Annual Report Download - page 125
Download and view the complete annual report
Please find page 125 of the 2009 PNC Bank annual report below. You can navigate through the pages in the report by either clicking on the pages listed below, or by using the keyword search tool below to find specific information within the annual report.-
 1
1 -
2
-
3
-
4
-
5
-
6
-
7
-
8
-
9
-
10
-
11
-
12
-
13
-
14
-
15
-
16
-
17
-
18
-
19
-
20
-
21
-
22
-
23
-
24
-
25
-
26
-
27
-
28
-
29
-
30
-
31
-
32
-
33
-
34
-
35
-
36
-
37
-
38
-
39
-
40
-
41
-
42
-
43
-
44
-
45
-
46
-
47
-
48
-
49
-
50
-
51
-
52
-
53
-
54
-
55
-
56
-
57
-
58
-
59
-
60
-
61
-
62
-
63
-
64
-
65
-
66
-
67
-
68
-
69
-
70
-
71
-
72
-
73
-
74
-
75
-
76
-
77
-
78
-
79
-
80
-
81
-
82
-
83
-
84
-
85
-
86
-
87
-
88
-
89
-
90
-
91
-
92
-
93
-
94
-
95
-
96
-
97
-
98
-
99
-
100
-
101
-
102
-
103
-
104
-
105
-
106
-
107
-
108
-
109
-
110
-
111
-
112
-
113
-
114
-
 115
115 -
 116
116 -
 117
117 -
 118
118 -
 119
119 -
 120
120 -
 121
121 -
 122
122 -
 123
123 -
 124
124 -
 125
125 -
 126
126 -
 127
127 -
 128
128 -
 129
129 -
 130
130 -
 131
131 -
 132
132 -
 133
133 -
 134
134 -
 135
135 -
136
-
137
-
138
-
139
-
140
-
141
-
142
-
143
-
144
-
145
-
146
-
147
-
148
-
149
-
150
-
151
-
152
-
153
-
154
-
155
-
156
-
157
-
158
-
159
-
160
-
161
-
162
-
163
-
164
-
165
-
166
-
167
-
168
-
169
-
170
-
171
-
172
-
173
-
174
-
175
-
176
-
177
-
178
-
179
-
180
-
181
-
182
-
183
-
184
-
185
-
186
-
187
-
188
-
189
-
190
-
191
-
192
-
193
-
194
-
195
-
196
 |
 |

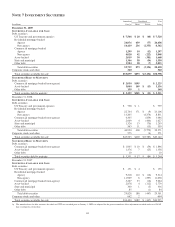
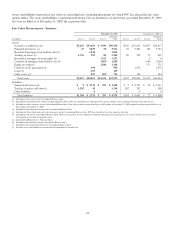
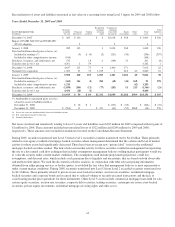
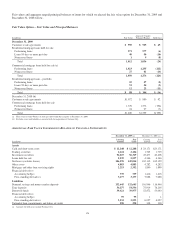
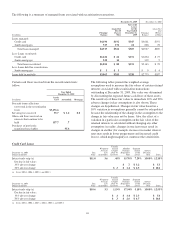
A detailed reconciliation of available for sale, trading securities and equity investments measured at fair value on a recurring basis
using Level 3 inputs for the year ended December 31, 2009 follows.
Level 3 Instruments Only
In millions
Residential
mortgage-
backed
agency
Residential
mortgage-
backed
non-agency
Commercial
mortgage-
backed
non-agency
Asset-
backed
State and
municipal
Other
debt
Corporate
stocks
and other
Total
available
for sale
securities
December 31, 2008 $3,304 $ 337 $ 833 $271 $ 34 $58 $ 4,837
National City acquisition $ 7 899 59 50 48 1,063
January 1, 2009 7 4,203 337 892 321 82 58 5,900
Total realized/unrealized gains or losses:
Included in earnings (**) (444) (6) (104) (9) (563)
Included in other comprehensive income (2) 616 627 (22) (2) 4 (6) 1,215
Purchases, issuances, and settlements, net (713) (253) (37) (23) (19) (5) (1,050)
Transfers into Level 3, net 4,640 (699) 525 (30) (5) 4,431
December 31, 2009 $ 5 $8,302 $ 6 $1,254 $266 $ 53 $47 $ 9,933
(**) Amounts attributable to unrealized gains or losses
related to available for sale securities held at
December 31, 2009: $ (444) $ (6) $ (104) $ (9) $ (563)
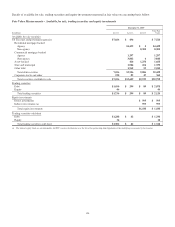
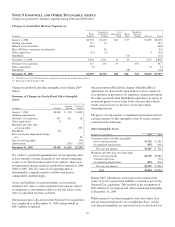
Level 3 Instruments Only
In millions
Trading
securities
debt
Trading
securities
equity
Equity
investments -
direct
Equity
investments -
indirect
December 31, 2008 $56 $ 17 $322 $249
National City acquisition 26 6 287 323
January 1, 2009 82 23 609 572
Total realized/unrealized gains or losses:
Included in earnings (**) (3) 1 (24) (20)
Purchases, issuances, and settlements, net 8 (20) 10 41
Transfers into Level 3, net 2 (4)
December 31, 2009 $89 $— $595 $593
(**) Amounts attributable to unrealized gains or losses
related to trading securities and equity investments held at
December 31, 2009: $ (33) $ (19)
Interest income earned from trading securities totaled $61
million for 2009, $116 million for 2008 and $116 million for
2007. These amounts are included in other interest income on
the Consolidated Income Statement.
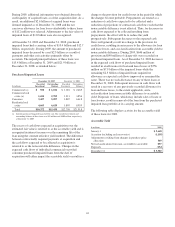
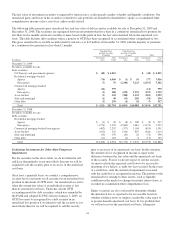
Nonrecurring Fair Value Changes
We may be required to measure certain other financial assets
at fair value on a nonrecurring basis. These adjustments
to fair value usually result from the application of
lower-of-cost-or-fair value accounting or write-downs of
individual assets due to impairment. The amounts below for
nonaccrual loans and loans held for sale represent the carrying
value of loans for which adjustments are primarily based on
the appraised value of collateral or based on an observable
market price, which often results in significant management
assumptions and input with respect to the determination of fair
value. The fair value determination of the equity investment
resulting in an impairment loss included below was based on
observable market data for other comparable entities as
adjusted for internal assumptions and unobservable inputs.
The amounts below for commercial servicing rights reflect a
recovery of a certain strata during 2009 while no strata were
impaired at December 31, 2009 and two strata were impaired
at December 31, 2008. The fair value of commercial mortgage
servicing rights is estimated by using an internal valuation
model. The model calculates the present value of estimated
future net servicing cash flows considering estimates of
servicing revenue and costs, discount rates and prepayment
speeds. Annually, this model is subject to an internal review
process to validate controls and model results.
121