PNC Bank 2009 Annual Report Download - page 43
Download and view the complete annual report
Please find page 43 of the 2009 PNC Bank annual report below. You can navigate through the pages in the report by either clicking on the pages listed below, or by using the keyword search tool below to find specific information within the annual report.-
 1
1 -
2
-
3
-
4
-
5
-
6
-
7
-
8
-
9
-
10
-
11
-
12
-
13
-
14
-
15
-
16
-
17
-
18
-
19
-
20
-
21
-
22
-
23
-
24
-
25
-
26
-
27
-
28
-
29
-
30
-
31
-
32
-
 33
33 -
 34
34 -
 35
35 -
 36
36 -
 37
37 -
 38
38 -
 39
39 -
 40
40 -
 41
41 -
 42
42 -
 43
43 -
 44
44 -
 45
45 -
 46
46 -
 47
47 -
 48
48 -
 49
49 -
 50
50 -
 51
51 -
 52
52 -
 53
53 -
54
-
55
-
56
-
57
-
58
-
59
-
60
-
61
-
62
-
63
-
64
-
65
-
66
-
67
-
68
-
69
-
70
-
71
-
72
-
73
-
74
-
75
-
76
-
77
-
78
-
79
-
80
-
81
-
82
-
83
-
84
-
85
-
86
-
87
-
88
-
89
-
90
-
91
-
92
-
93
-
94
-
95
-
96
-
97
-
98
-
99
-
100
-
101
-
102
-
103
-
104
-
105
-
106
-
107
-
108
-
109
-
110
-
111
-
112
-
113
-
114
-
115
-
116
-
117
-
118
-
119
-
120
-
121
-
122
-
123
-
124
-
125
-
126
-
127
-
128
-
129
-
130
-
131
-
132
-
133
-
134
-
135
-
136
-
137
-
138
-
139
-
140
-
141
-
142
-
143
-
144
-
145
-
146
-
147
-
148
-
149
-
150
-
151
-
152
-
153
-
154
-
155
-
156
-
157
-
158
-
159
-
160
-
161
-
162
-
163
-
164
-
165
-
166
-
167
-
168
-
169
-
170
-
171
-
172
-
173
-
174
-
175
-
176
-
177
-
178
-
179
-
180
-
181
-
182
-
183
-
184
-
185
-
186
-
187
-
188
-
189
-
190
-
191
-
192
-
193
-
194
-
195
-
196
 |
 |

program will remain in effect until fully utilized or until
modified, superseded or terminated. The extent and timing of
share repurchases under this program will depend on a number
of factors including, among others, market and general
economic conditions, economic and regulatory capital
considerations, alternative uses of capital, regulatory and
contractual limitations, and the potential impact on our credit
ratings. We did not purchase any shares during 2009 under
this program.
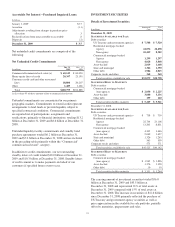
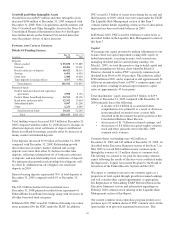
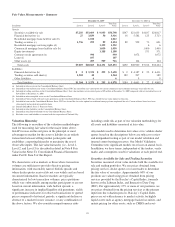
Risk-Based Capital
Dollars in millions
Dec. 31
2009
Dec. 31
2008
Capital components
Shareholders’ equity
Common $ 21,967 $ 17,490
Preferred 7,975 7,932
Trust preferred capital securities 2,996 2,898
Noncontrolling interests 1,611 1,506
Goodwill and other intangible assets (10,652) (9,800)
Eligible deferred income taxes on
goodwill and other intangible assets 738 594
Pension, other postretirement benefit
plan adjustments 542 666
Net unrealized securities losses,
after-tax 1,575 3,618
Net unrealized losses (gains) on cash
flow hedge derivatives, after-tax (166) (374)
Other (63) (243)
Tier 1 risk-based capital 26,523 24,287
Subordinated debt 5,356 5,676
Eligible allowance for credit losses 2,934 3,153
Total risk-based capital $ 34,813 $ 33,116
Tier 1 common capital
Tier 1 risk-based capital $ 26,523 $ 24,287
Preferred equity (7,975) (7,932)
Trust preferred capital securities (2,996) (2,898)
Noncontrolling interests (1,611) (1,506)
Tier 1 common capital $ 13,941 $ 11,951
Assets
Risk-weighted assets, including off-
balance sheet instruments and market
risk equivalent assets $232,257 $251,106
Adjusted average total assets 263,103 138,689
Capital ratios
Tier 1 risk-based 11.4% 9.7%
Tier 1 common 6.0 4.8
Total risk-based 15.0 13.2
Leverage 10.1 17.5
Federal banking regulators have stated that they expect all
bank holding companies to have a level and composition of
Tier 1 capital well in excess of the 4% regulatory minimum,
and they have required the largest US bank holding
companies, including PNC, to have a capital buffer sufficient
to withstand losses and allow them to meet credit needs of
their customers through the economic downturn. They have
also stated their view that common equity should be the
dominant form of Tier 1 capital. As a result, regulators are
now emphasizing the Tier 1 common capital ratio in their
evaluation of bank holding company capital levels, although
this metric is not provided for in the regulations. We seek to
manage our capital consistent with these regulatory principles,
and believe that our year-end capital levels were aligned with
them. Actions that we have taken since year-end that increase
our Tier 1 common capital ratio on a pro forma basis are
described below.
Capital levels were strengthened during 2009. Higher capital
levels were net of dividend payments including $332 million
paid to the US Department of the Treasury during 2009 on
$7.6 billion of preferred stock. See Repurchase of Outstanding
TARP Preferred Stock and Pending Sale of PNC Global
Investment Servicing in the Executive Summary section of
Item 7. Our Tier 1 risk-based capital ratio and our Tier 1
common capital ratio would have been 10.3% and 8.0%,
respectively, at December 31, 2009 had they included the
estimated net impact of the redemption of the outstanding
TARP preferred stock, our February 2010 equity offering
discussed further in the Liquidity Risk Management section of
Item 7, and the pending sale of GIS. We provide a
reconciliation of these ratios reflecting the impact of the
TARP redemption, common equity offering and sale of GIS to
the ratios set forth in the Risk-Based Capital table above in the
Statistical Information (Unaudited) section in Item 8 of this
Report.
PNC’s Tier 1 risk-based capital ratio increased by 170 basis
points to 11.4% at December 31, 2009 from 9.7% at
December 31, 2008. The increase in the ratio was due to
higher risk-based capital primarily from retained earnings and
the May 2009 common equity issuance coupled with a decline
in risk-weighted assets. Our Tier 1 common capital ratio was
6.0% at December 31, 2009 compared with 4.8% at
December 31, 2008.
The leverage ratio at December 31, 2008 reflected the
favorable impact on Tier 1 risk-based capital from the
issuance of securities under TARP and the issuance of PNC
common stock in connection with the National City
acquisition, both of which occurred on December 31, 2008. In
addition, the ratio as of that date did not reflect any impact of
National City on PNC’s adjusted average total assets.
The access to, and cost of, funding new business initiatives
including acquisitions, the ability to engage in expanded
business activities, the ability to pay dividends, the level of
deposit insurance costs, and the level and nature of regulatory
oversight depend, in part, on a financial institution’s capital
strength.
We merged the charter of PNC Bank Delaware into PNC
Bank, N.A. during August 2009 and merged the charter of
National City Bank into PNC Bank, N.A. in November 2009.
39