PNC Bank 2009 Annual Report Download - page 124
Download and view the complete annual report
Please find page 124 of the 2009 PNC Bank annual report below. You can navigate through the pages in the report by either clicking on the pages listed below, or by using the keyword search tool below to find specific information within the annual report.-
 1
1 -
2
-
3
-
4
-
5
-
6
-
7
-
8
-
9
-
10
-
11
-
12
-
13
-
14
-
15
-
16
-
17
-
18
-
19
-
20
-
21
-
22
-
23
-
24
-
25
-
26
-
27
-
28
-
29
-
30
-
31
-
32
-
33
-
34
-
35
-
36
-
37
-
38
-
39
-
40
-
41
-
42
-
43
-
44
-
45
-
46
-
47
-
48
-
49
-
50
-
51
-
52
-
53
-
54
-
55
-
56
-
57
-
58
-
59
-
60
-
61
-
62
-
63
-
64
-
65
-
66
-
67
-
68
-
69
-
70
-
71
-
72
-
73
-
74
-
75
-
76
-
77
-
78
-
79
-
80
-
81
-
82
-
83
-
84
-
85
-
86
-
87
-
88
-
89
-
90
-
91
-
92
-
93
-
94
-
95
-
96
-
97
-
98
-
99
-
100
-
101
-
102
-
103
-
104
-
105
-
106
-
107
-
108
-
109
-
110
-
111
-
112
-
113
-
 114
114 -
 115
115 -
 116
116 -
 117
117 -
 118
118 -
 119
119 -
 120
120 -
 121
121 -
 122
122 -
 123
123 -
 124
124 -
 125
125 -
 126
126 -
 127
127 -
 128
128 -
 129
129 -
 130
130 -
 131
131 -
 132
132 -
 133
133 -
 134
134 -
135
-
136
-
137
-
138
-
139
-
140
-
141
-
142
-
143
-
144
-
145
-
146
-
147
-
148
-
149
-
150
-
151
-
152
-
153
-
154
-
155
-
156
-
157
-
158
-
159
-
160
-
161
-
162
-
163
-
164
-
165
-
166
-
167
-
168
-
169
-
170
-
171
-
172
-
173
-
174
-
175
-
176
-
177
-
178
-
179
-
180
-
181
-
182
-
183
-
184
-
185
-
186
-
187
-
188
-
189
-
190
-
191
-
192
-
193
-
194
-
195
-
196
 |
 |

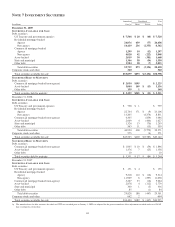
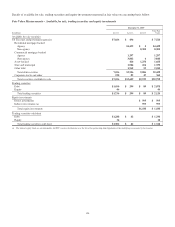
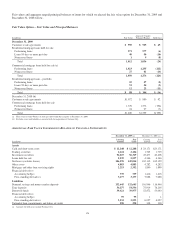
Details of available for sale, trading securities and equity investments measured at fair value on a recurring basis follow.
Fair Value Measurements – Available for sale, trading securities and equity investments
December 31, 2009
In millions Level 1 Level 2 Level 3
Total Fair
Value
Available for sale securities
US Treasury and government agencies $7,026 $ 494 $ 7,520
Residential mortgage-backed
Agency 24,433 $ 5 24,438
Non-agency 8,302 8,302
Commercial mortgage-backed
Agency 1,297 1,297
Non-agency 3,842 6 3,848
Asset-backed 414 1,254 1,668
State and municipal 1,084 266 1,350
Other debt 1,962 53 2,015
Total debt securities 7,026 33,526 9,886 50,438
Corporate stocks and other 230 83 47 360
Total securities available for sale $7,256 $33,609 $9,933 $50,798
Trading securities
Debt $1,690 $ 299 $ 89 $ 2,078
Equity 46 46
Total trading securities $1,736 $ 299 $ 89 $ 2,124
Equity investments
Direct investments $ 595 $ 595
Indirect investments (a) 593 593
Total equity investments $1,188 $ 1,188
Trading securities sold short
Debt $1,288 $ 42 $ 1,330
Equity 14 14
Total trading securities sold short $1,302 $ 42 $ 1,344
(a) The indirect equity funds are not redeemable, but PNC receives distributions over the life of the partnership from liquidation of the underlying investments by the investee.
120