PNC Bank 2009 Annual Report Download - page 54
Download and view the complete annual report
Please find page 54 of the 2009 PNC Bank annual report below. You can navigate through the pages in the report by either clicking on the pages listed below, or by using the keyword search tool below to find specific information within the annual report.-
 1
1 -
2
-
3
-
4
-
5
-
6
-
7
-
8
-
9
-
10
-
11
-
12
-
13
-
14
-
15
-
16
-
17
-
18
-
19
-
20
-
21
-
22
-
23
-
24
-
25
-
26
-
27
-
28
-
29
-
30
-
31
-
32
-
33
-
34
-
35
-
36
-
37
-
38
-
39
-
40
-
41
-
42
-
43
-
 44
44 -
 45
45 -
 46
46 -
 47
47 -
 48
48 -
 49
49 -
 50
50 -
 51
51 -
 52
52 -
 53
53 -
 54
54 -
 55
55 -
 56
56 -
 57
57 -
 58
58 -
 59
59 -
 60
60 -
 61
61 -
 62
62 -
 63
63 -
 64
64 -
65
-
66
-
67
-
68
-
69
-
70
-
71
-
72
-
73
-
74
-
75
-
76
-
77
-
78
-
79
-
80
-
81
-
82
-
83
-
84
-
85
-
86
-
87
-
88
-
89
-
90
-
91
-
92
-
93
-
94
-
95
-
96
-
97
-
98
-
99
-
100
-
101
-
102
-
103
-
104
-
105
-
106
-
107
-
108
-
109
-
110
-
111
-
112
-
113
-
114
-
115
-
116
-
117
-
118
-
119
-
120
-
121
-
122
-
123
-
124
-
125
-
126
-
127
-
128
-
129
-
130
-
131
-
132
-
133
-
134
-
135
-
136
-
137
-
138
-
139
-
140
-
141
-
142
-
143
-
144
-
145
-
146
-
147
-
148
-
149
-
150
-
151
-
152
-
153
-
154
-
155
-
156
-
157
-
158
-
159
-
160
-
161
-
162
-
163
-
164
-
165
-
166
-
167
-
168
-
169
-
170
-
171
-
172
-
173
-
174
-
175
-
176
-
177
-
178
-
179
-
180
-
181
-
182
-
183
-
184
-
185
-
186
-
187
-
188
-
189
-
190
-
191
-
192
-
193
-
194
-
195
-
196
 |
 |

R
ETAIL
B
ANKING
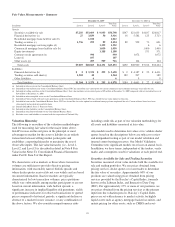
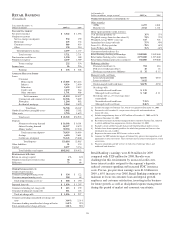
(Unaudited)
Year ended December 31
Dollars in millions 2009 (a) 2008
I
NCOME
S
TATEMENT
Net interest income $ 3,522 $ 1,594
Noninterest income
Service charges on deposits 930 359
Brokerage 245 152
Consumer services 886 416
Other 138 210
Total noninterest income 2,199 1,137
Total revenue 5,721 2,731
Provision for credit losses 1,330 388
Noninterest expense 4,169 1,789
Pretax earnings 222 554
Income taxes 86 226
Earnings $ 136 $ 328
A
VERAGE
B
ALANCE
S
HEET
Loans
Consumer
Home equity $ 27,403 $13,263
Indirect 4,036 2,050
Education 5,625 2,012
Credit cards 2,239 264
Other consumer 1,791 468
Total consumer 41,094 18,057
Commercial and commercial real estate 12,306 5,029
Floor plan 1,264 992
Residential mortgage 2,064 2,029
Total loans 56,728 26,107
Goodwill and other intangible assets 5,842 5,192
Other assets 2,750 1,623
Total assets $ 65,320 $32,922
Deposits
Noninterest-bearing demand $ 16,308 $ 9,191
Interest-bearing demand 18,357 8,073
Money market 39,394 17,220
Total transaction deposits 74,059 34,484
Savings 6,610 2,681
Certificates of deposit 53,145 15,800
Total deposits 133,814 52,965
Other liabilities 51 333
Capital 8,497 3,334
Total liabilities and equity $142,362 $56,632
P
ERFORMANCE
R
ATIOS
Return on average capital 2% 10%
Noninterest income to total revenue 38 42
Efficiency 73 66
O
THER
I
NFORMATION
(b)
Credit-related statistics:
Commercial nonperforming assets $ 324 $ 122
Consumer nonperforming assets 284 68
Total nonperforming assets (c) $ 608 $ 190
Impaired loans (d) $ 1,056 $ 1,297
Commercial lending net charge-offs $ 415 $ 139
Consumer lending net charge-offs 611 118
Total net charge-offs $ 1,026 $ 257
Commercial lending annualized net charge-off
ratio 3.06% 2.31%
Consumer lending annualized net charge-off ratio 1.42% .59%
Total annualized net charge-off ratio 1.81% .98%
At December 31
Dollars in millions, except as noted 2009 (a) 2008
O
THER
I
NFORMATION
(
CONTINUED
)(b)
Other statistics:
ATMs 6,473 4,041
Branches (e) 2,512 1,141
Home equity portfolio credit statistics:
% of first lien positions (f) 35% 37%
Weighted average loan-to-value ratios (f) 74% 73%
Weighted average FICO scores (g) 727 726
Annualized net charge-off ratio .75% .49%
Loans 30 – 89 days past due .78% .68%
Loans 90 days past due .76% .62%
Customer-related statistics (h):
Retail Banking checking relationships 5,042,000 2,402,000
Retail online banking active customers 2,771,000 1,215,000
Retail online bill payment active customers 766,000 379,000
Brokerage statistics:
Financial consultants (i) 704 414
Full service brokerage offices 40 23
Brokerage account assets (billions) $32 $15
Managed credit card loans:
Loans held in portfolio $2,556 $330
Loans securitized 1,622
Total managed credit card loans $4,178 $330
Net charge-offs:
Securitized credit card loans $ 131
Managed credit card loans $ 340 $11
Net charge-offs as a % of average loans
(annualized):
Securitized credit card loans 7.31%
Managed credit card loans 8.46% 4.17%
(a) Includes the impact of National City, which we acquired on December 31, 2008.
(b) Presented as of December 31 except for net charge-offs and annualized net
charge-off ratios.
(c) Includes nonperforming loans of $597 million at December 31, 2009 and $176
million at December 31, 2008.
(d) Recorded investment of purchased impaired loans related to National City, adjusted
to reflect additional loan impairments effective December 31, 2008.
(e) Excludes certain satellite branches that provide limited products and/or services.
(f) Includes loans from acquired portfolios for which lien position and loan-to-value
information was not available.
(g) Represents the most recent FICO scores we have on file.
(h) Amounts for 2009 include the impact of National City prior to the completion of all
application system conversions. These amounts may be refined subsequent to system
conversions.
(i) Financial consultants provide services in full service brokerage offices and
traditional bank branches.
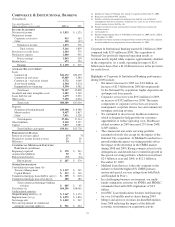
Retail Banking’s earnings were $136 million for 2009
compared with $328 million for 2008. Results were
challenged in this environment by increased credit costs,
lower interest credits assigned to the segment’s deposits,
reduced consumer spending and increased FDIC insurance
costs. Pre-tax, pre-provision earnings were $1.6 billion for
2009, a 65% increase over 2008. Retail Banking continues to
maintain its focus on customer, loan and deposit growth,
employee and customer satisfaction, investing in the business
for future growth, as well as disciplined expense management
during this period of market and economic uncertainty.
50