PNC Bank 2009 Annual Report Download - page 61
Download and view the complete annual report
Please find page 61 of the 2009 PNC Bank annual report below. You can navigate through the pages in the report by either clicking on the pages listed below, or by using the keyword search tool below to find specific information within the annual report.-
 1
1 -
2
-
3
-
4
-
5
-
6
-
7
-
8
-
9
-
10
-
11
-
12
-
13
-
14
-
15
-
16
-
17
-
18
-
19
-
20
-
21
-
22
-
23
-
24
-
25
-
26
-
27
-
28
-
29
-
30
-
31
-
32
-
33
-
34
-
35
-
36
-
37
-
38
-
39
-
40
-
41
-
42
-
43
-
44
-
45
-
46
-
47
-
48
-
49
-
50
-
 51
51 -
 52
52 -
 53
53 -
 54
54 -
 55
55 -
 56
56 -
 57
57 -
 58
58 -
 59
59 -
 60
60 -
 61
61 -
 62
62 -
 63
63 -
 64
64 -
 65
65 -
 66
66 -
 67
67 -
 68
68 -
 69
69 -
 70
70 -
 71
71 -
72
-
73
-
74
-
75
-
76
-
77
-
78
-
79
-
80
-
81
-
82
-
83
-
84
-
85
-
86
-
87
-
88
-
89
-
90
-
91
-
92
-
93
-
94
-
95
-
96
-
97
-
98
-
99
-
100
-
101
-
102
-
103
-
104
-
105
-
106
-
107
-
108
-
109
-
110
-
111
-
112
-
113
-
114
-
115
-
116
-
117
-
118
-
119
-
120
-
121
-
122
-
123
-
124
-
125
-
126
-
127
-
128
-
129
-
130
-
131
-
132
-
133
-
134
-
135
-
136
-
137
-
138
-
139
-
140
-
141
-
142
-
143
-
144
-
145
-
146
-
147
-
148
-
149
-
150
-
151
-
152
-
153
-
154
-
155
-
156
-
157
-
158
-
159
-
160
-
161
-
162
-
163
-
164
-
165
-
166
-
167
-
168
-
169
-
170
-
171
-
172
-
173
-
174
-
175
-
176
-
177
-
178
-
179
-
180
-
181
-
182
-
183
-
184
-
185
-
186
-
187
-
188
-
189
-
190
-
191
-
192
-
193
-
194
-
195
-
196
 |
 |

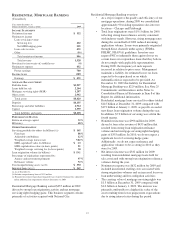
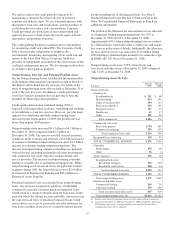
R
ESIDENTIAL
M
ORTGAGE
B
ANKING
(Unaudited)
Year ended December 31
Dollars in millions, except as noted 2009
I
NCOME
S
TATEMENT
Net interest income $ 332
Noninterest income
Loan servicing revenue
Servicing fees 222
Net MSR hedging gains 355
Loan sales revenue 435
Other (16)
Total noninterest income 996
Total revenue 1,328
Provision for (recoveries of) credit losses (4)
Noninterest expense 632
Pretax earnings 700
Income taxes 265
Earnings $ 435
A
VERAGE
B
ALANCE
S
HEET
Portfolio loans $1,957
Loans held for sale 2,204
Mortgage servicing rights (MSR) 1,297
Other assets 2,962
Total assets $8,420
Deposits $4,135
Borrowings and other liabilities 2,924
Capital 1,359
Total liabilities and equity $8,418
P
ERFORMANCE
R
ATIOS
Return on average capital 32%
Efficiency 48%
O
THER
I
NFORMATION
Servicing portfolio for others (in billions) (a) $ 145
Fixed rate 88%
Adjustable rate/balloon 12%
Weighted average interest rate 5.82%
MSR capitalized value (in billions) $ 1.3
MSR capitalization value (in basis points) 91
Weighted average servicing fee (in basis points) 30
Loan origination volume (in billions) $ 19.1
Percentage of originations represented by:
Agency and government programs 97%
Refinance volume 72%
Total nonperforming assets (a) (b) $ 370
Impaired loans (a) (c) $ 369
(a) As of December 31.
(b) Includes nonperforming loans of $215 million.
(c) Recorded investment of purchased impaired loans related to National City, adjusted to
reflect additional loan impairments effective December 31, 2008.
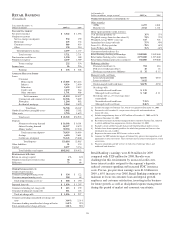
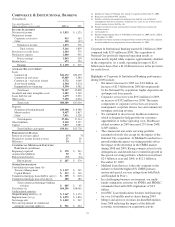
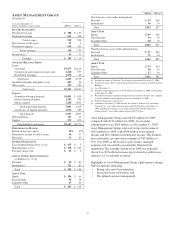
Residential Mortgage Banking earned $435 million in 2009
driven by strong loan origination activity and net mortgage
servicing rights hedging gains. This business segment consists
primarily of activities acquired with National City.
Residential Mortgage Banking overview:
• As a step to improve the quality and efficiency of our
mortgage operations, during 2009 we consolidated
approximately 90 existing operations sites into two
locations – Chicago and Pittsburgh.
• Total loan originations were $19.1 billion for 2009,
reflecting strong loan refinance activity consistent
with industry trends. However, rising mortgage rates
during the second half of 2009 reduced incoming
application volume. Loans were primarily originated
through direct channels under agency (FNMA,
FHLMC, FHA/VA) guidelines. Investors may
request PNC to indemnify them against losses on
certain loans or to repurchase loans that they believe
do not comply with applicable representations.
During 2009, the frequency of such requests
increased in relation to prior years. Management
maintains a liability for estimated losses on loans
expected to be repurchased or on which
indemnification is expected to be provided. At
December 31, 2009 this liability for Residential
Mortgage Banking was $229 million. See Note 25
Commitments and Guarantees in the Notes to
Consolidated Financial Statements in Item 8 of this
Report for additional information.
• Residential mortgage loans serviced for others totaled
$145 billion at December 31, 2009 compared with
$173 billion at January 1, 2009, as payoffs exceeded
new direct loan origination volume during the year.
In addition, $7.9 billion of servicing was sold in the
fourth quarter.
• Noninterest income was $996 million for 2009,
driven by loan sales revenue of $435 million that
resulted from strong loan origination refinance
volume and net mortgage servicing rights hedging
gains of $355 million. In 2010, we do not expect a
significant level of servicing hedge gains.
Additionally, we do not expect refinance and
application volumes to be as strong in 2010 as they
were for 2009.
• Net interest income was $332 million for 2009
resulting from residential mortgage loans held for
sale associated with strong loan origination refinance
volumes during the year.
• Noninterest expense was $632 million for 2009 and
included incremental staffing costs associated with
strong origination volumes and an increased focus on
loan underwriting and loss mitigation activities.
• The carrying value of mortgage servicing rights was
$1.3 billion at December 31, 2009 compared with
$1.0 billion at January 1, 2009. The increase was
primarily attributable to a higher fair value of the
asset resulting from lower prepayment expectations
due to rising interest rates during the period.
57