PNC Bank 2009 Annual Report Download - page 175
Download and view the complete annual report
Please find page 175 of the 2009 PNC Bank annual report below. You can navigate through the pages in the report by either clicking on the pages listed below, or by using the keyword search tool below to find specific information within the annual report.-
 1
1 -
2
-
3
-
4
-
5
-
6
-
7
-
8
-
9
-
10
-
11
-
12
-
13
-
14
-
15
-
16
-
17
-
18
-
19
-
20
-
21
-
22
-
23
-
24
-
25
-
26
-
27
-
28
-
29
-
30
-
31
-
32
-
33
-
34
-
35
-
36
-
37
-
38
-
39
-
40
-
41
-
42
-
43
-
44
-
45
-
46
-
47
-
48
-
49
-
50
-
51
-
52
-
53
-
54
-
55
-
56
-
57
-
58
-
59
-
60
-
61
-
62
-
63
-
64
-
65
-
66
-
67
-
68
-
69
-
70
-
71
-
72
-
73
-
74
-
75
-
76
-
77
-
78
-
79
-
80
-
81
-
82
-
83
-
84
-
85
-
86
-
87
-
88
-
89
-
90
-
91
-
92
-
93
-
94
-
95
-
96
-
97
-
98
-
99
-
100
-
101
-
102
-
103
-
104
-
105
-
106
-
107
-
108
-
109
-
110
-
111
-
112
-
113
-
114
-
115
-
116
-
117
-
118
-
119
-
120
-
121
-
122
-
123
-
124
-
125
-
126
-
127
-
128
-
129
-
130
-
131
-
132
-
133
-
134
-
135
-
136
-
137
-
138
-
139
-
140
-
141
-
142
-
143
-
144
-
145
-
146
-
147
-
148
-
149
-
150
-
151
-
152
-
153
-
154
-
155
-
156
-
157
-
158
-
159
-
160
-
161
-
162
-
163
-
164
-
 165
165 -
 166
166 -
 167
167 -
 168
168 -
 169
169 -
 170
170 -
 171
171 -
 172
172 -
 173
173 -
 174
174 -
 175
175 -
 176
176 -
 177
177 -
 178
178 -
 179
179 -
 180
180 -
 181
181 -
 182
182 -
 183
183 -
 184
184 -
 185
185 -
186
-
187
-
188
-
189
-
190
-
191
-
192
-
193
-
194
-
195
-
196
 |
 |

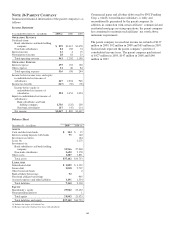
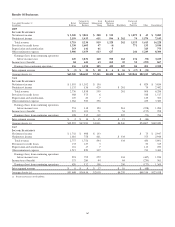
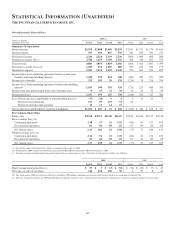
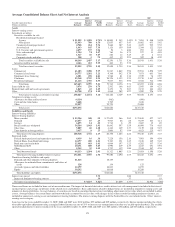
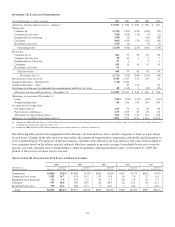
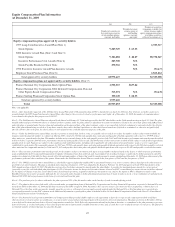
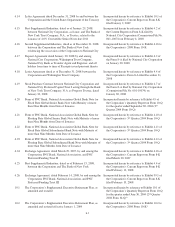
Average Consolidated Balance Sheet And Net Interest Analysis
2009 2008 2007
Taxable-equivalent basis
Dollars in millions
Average
Balances
Interest
Income/
Expense
Average
Yields/
Rates
Average
Balances
Interest
Income/
Expense
Average
Yields/
Rates
Average
Balances
Interest
Income/
Expense
Average
Yields/
Rates
Assets
Interest-earning assets:
Investment securities
Securities available for sale
Residential mortgage-backed
Agency $ 21,889 $ 1,038 4.74% $ 10,003 $ 545 5.45% $ 7,481 $ 408 5.45%
Non-agency 11,993 780 6.50 12,055 657 5.45 11,682 633 5.42
Commercial mortgage-backed 4,748 264 5.56 5,666 307 5.42 4,025 222 5.52
Asset-backed 1,963 145 7.39 3,126 159 5.09 2,394 122 5.10
U.S. Treasury and government agencies 4,477 137 3.06 50 3 6.00 293 13 4.44
State and municipal 1,354 74 5.47 764 36 4.71 227 11 4.85
Other debt 1,327 46 3.47 220 12 5.45 47 4 8.51
Corporate stocks and other 398 3 .75 412 12 2.91 392 18 4.59
Total securities available for sale 48,149 2,487 5.17 32,296 1,731 5.36 26,541 1,431 5.39
Securities held to maturity 4,146 222 5.35 402 23 5.72
Total investment securities 52,295 2,709 5.18 32,698 1,754 5.36 26,541 1,431 5.39
Loans
Commercial 61,183 3,288 5.37 31,267 1,862 5.96 25,941 1,890 7.29
Commercial real estate 24,775 1,292 5.21 9,368 542 5.79 7,671 603 7.86
Equipment lease financing 6,201 298 4.81 2,566 81 3.16 2,559 76 2.97
Consumer 52,368 2,745 5.24 20,526 1,135 5.53 17,718 1,167 6.59
Residential mortgage 21,116 1,336 6.33 9,017 536 5.94 8,564 512 5.98
Total loans 165,643 8,959 5.41 72,744 4,156 5.71 62,453 4,248 6.80
Loans held for sale 3,976 270 6.79 2,502 166 6.63 2,955 184 6.23
Federal funds sold and resale agreements 1,865 42 2.25 2,472 71 2.87 2,152 104 4.83
Other 14,708 174 1.18 4,068 202 4.97 3,909 226 5.78
Total interest-earning assets/interest income 238,487 12,154 5.10 114,484 6,349 5.55 98,010 6,193 6.32
Noninterest-earning assets:
Allowance for loan and lease losses (4,316) (962) (690)
Cash and due from banks 3,648 2,705 3,018
Other 39,057 25,793 23,080
Total assets $276,876 $142,020 $123,418
Liabilities and Equity
Interest-bearing liabilities:
Interest-bearing deposits
Money market $ 55,326 548 .99 $ 27,625 566 2.05 $ 23,840 827 3.47
Demand 23,477 67 .29 9,947 68 .68 9,259 103 1.11
Savings 6,495 14 .22 2,714 8 .29 2,687 12 .45
Retail certificates of deposit 54,584 1,043 1.91 16,642 597 3.59 16,690 776 4.65
Other time 5,009 60 1.20 4,424 149 3.37 2,119 110 5.19
Time deposits in foreign offices 3,637 9 .25 5,006 97 1.94 4,623 225 4.87
Total interest-bearing deposits 148,528 1,741 1.17 66,358 1,485 2.24 59,218 2,053 3.47
Borrowed funds
Federal funds purchased and repurchase agreements 4,439 16 .36 7,228 156 2.16 7,983 394 4.94
Federal Home Loan Bank borrowings 14,177 200 1.41 9,303 321 3.45 2,168 109 5.03
Bank notes and senior debt 12,981 443 3.41 6,064 197 3.25 6,282 337 5.36
Subordinated debt 10,191 600 5.89 4,990 219 4.39 4,247 251 5.91
Other 2,345 35 1.49 3,737 112 3.00 2,344 107 4.56
Total borrowed funds 44,133 1,294 2.93 31,322 1,005 3.21 23,024 1,198 5.20
Total interest-bearing liabilities/interest expense 192,661 3,035 1.58 97,680 2,490 2.55 82,242 3,251 3.95
Noninterest-bearing liabilities and equity:
Demand and other noninterest-bearing deposits 41,416 18,155 17,587
Allowance for unfunded loan commitments and letters of
credit 328 134 125
Accrued expenses and other liabilities 12,179 10,033 8,195
Equity 30,292 16,018 15,269
Total liabilities and equity $276,876 $142,020 $123,418
Interest rate spread 3.52 3.00 2.37
Impact of noninterest-bearing sources .30 .37 .63
Net interest income/margin $ 9,119 3.82% $3,859 3.37% $2,942 3.00%
Nonaccrual loans are included in loans, net of unearned income. The impact of financial derivatives used in interest rate risk management is included in the interest
income/expense and average yields/rates of the related assets and liabilities. Basis adjustments related to hedged items are included in noninterest-earning assets and
noninterest-bearing liabilities. Average balances of securities are based on amortized historical cost (excluding adjustments to fair value which are included in other
assets). Average balances for certain loans and borrowed funds accounted for at fair value, with changes in fair value recorded in trading noninterest income, are
included in noninterest-earning assets and noninterest-bearing liabilities. The interest-earning deposits with the Federal Reserve are included in the ‘Other’ interest-
earning assets category.
Loan fees for the years ended December 31, 2009, 2008 and 2007 were $162 million, $55 million and $39 million, respectively. Interest income includes the effects
of taxable-equivalent adjustments using a marginal federal income tax rate of 35% to increase tax-exempt interest income to a taxable-equivalent basis. The taxable-
equivalent adjustments to interest income for the years ended December 31, 2009, 2008 and 2007 were $65 million, $36 million and $27 million, respectively.
171