PNC Bank 2009 Annual Report Download - page 67
Download and view the complete annual report
Please find page 67 of the 2009 PNC Bank annual report below. You can navigate through the pages in the report by either clicking on the pages listed below, or by using the keyword search tool below to find specific information within the annual report.-
 1
1 -
2
-
3
-
4
-
5
-
6
-
7
-
8
-
9
-
10
-
11
-
12
-
13
-
14
-
15
-
16
-
17
-
18
-
19
-
20
-
21
-
22
-
23
-
24
-
25
-
26
-
27
-
28
-
29
-
30
-
31
-
32
-
33
-
34
-
35
-
36
-
37
-
38
-
39
-
40
-
41
-
42
-
43
-
44
-
45
-
46
-
47
-
48
-
49
-
50
-
51
-
52
-
53
-
54
-
55
-
56
-
 57
57 -
 58
58 -
 59
59 -
 60
60 -
 61
61 -
 62
62 -
 63
63 -
 64
64 -
 65
65 -
 66
66 -
 67
67 -
 68
68 -
 69
69 -
 70
70 -
 71
71 -
 72
72 -
 73
73 -
 74
74 -
 75
75 -
 76
76 -
 77
77 -
78
-
79
-
80
-
81
-
82
-
83
-
84
-
85
-
86
-
87
-
88
-
89
-
90
-
91
-
92
-
93
-
94
-
95
-
96
-
97
-
98
-
99
-
100
-
101
-
102
-
103
-
104
-
105
-
106
-
107
-
108
-
109
-
110
-
111
-
112
-
113
-
114
-
115
-
116
-
117
-
118
-
119
-
120
-
121
-
122
-
123
-
124
-
125
-
126
-
127
-
128
-
129
-
130
-
131
-
132
-
133
-
134
-
135
-
136
-
137
-
138
-
139
-
140
-
141
-
142
-
143
-
144
-
145
-
146
-
147
-
148
-
149
-
150
-
151
-
152
-
153
-
154
-
155
-
156
-
157
-
158
-
159
-
160
-
161
-
162
-
163
-
164
-
165
-
166
-
167
-
168
-
169
-
170
-
171
-
172
-
173
-
174
-
175
-
176
-
177
-
178
-
179
-
180
-
181
-
182
-
183
-
184
-
185
-
186
-
187
-
188
-
189
-
190
-
191
-
192
-
193
-
194
-
195
-
196
 |
 |

rates and prepayment speeds could affect the future values of
MSRs. Hedging results can frequently be volatile in the short
term, but over longer periods of time are expected to protect
the economic value of the MSR portfolio.
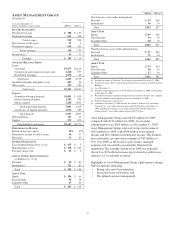
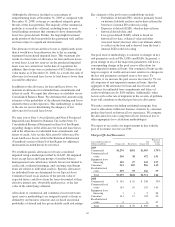
The fair value of residential MSRs and significant inputs to
the valuation model as of December 31, 2009 are shown in the
table below. The expected and actual rates of mortgage loan
prepayments are the most significant factors driving the fair
value. Management uses an internal proprietary model to
estimate future loan prepayments. This model uses empirical
data drawn from the historical performance of our managed
portfolio, as adjusted for current market conditions. Future
interest rates are another important factor in the valuation of
MSRs. Management utilizes market implied forward interest
rates to estimate the future direction of mortgage and discount
rates. The forward rates utilized are derived from the current
yield curve for US dollar interest rate swaps and are consistent
with pricing of capital markets instruments. Changes in the
shape and slope of the forward curve in future periods may
result in volatility in the fair value estimate.
Dollars in millions
December 31
2009
Fair value $1,332
Weighted-average life (in years) 4.5
Weighted-average constant prepayment rate 19.92%
Spread over forward interest rate swap rates 12.16%
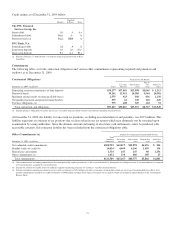
A sensitivity analysis of the hypothetical effect on the fair
value of MSRs to adverse changes in key assumptions is
presented below. Changes in fair value generally cannot be
extrapolated because the relationship of the change in the
assumption to the change in fair value may not be linear. Also,
the effect of a variation in a particular assumption on the fair
value of the MSRs is calculated independently without
changing any other assumption. In reality, changes in one
factor may result in changes in another (for example, changes
in mortgage interest rates, which drive changes in prepayment
rate estimates, could result in changes in the interest rate
spread), which could either magnify or counteract the
sensitivities.
Dollars in millions
December 31
2009
Prepayment rate:
Decline in fair value from 10% adverse change $56
Decline in fair value from 20% adverse change $109
Spread over forward interest rate swap rates:
Decline in fair value from 10% adverse change $55
Decline in fair value from 20% adverse change $106
Income Taxes
In the normal course of business, we and our subsidiaries enter
into transactions for which the tax treatment is unclear or
subject to varying interpretations. In addition, filing
requirements, methods of filing and the calculation of taxable
income in various state and local jurisdictions are subject to
differing interpretations.
We evaluate and assess the relative risks and merits of the
appropriate tax treatment of transactions, filing positions,
filing methods and taxable income calculations after
considering statutes, regulations, judicial precedent, and other
information, and maintain tax accruals consistent with our
evaluation of these relative risks and merits. The result of our
evaluation and assessment is by its nature an estimate. We and
our subsidiaries are routinely subject to audit and challenges
from taxing authorities. In the event we resolve a challenge for
an amount different than amounts previously accrued, we will
account for the difference in the period in which we resolve
the matter.
Additional information regarding our Critical Accounting
Policies and Judgments is found elsewhere in this Item 7 and
in the Notes To Consolidated Financial Statements in Item 8
of this Report.
R
ECENT
A
CCOUNTING
P
RONOUNCEMENTS
See Note 1 Accounting Policies in the Notes To Consolidated
Financial Statements in Item 8 of this Report for information
on new accounting pronouncements that were effective in
2008, 2009 or became effective on January 1, 2010.
In addition, the following Accounting Standards Update
(ASU) was issued in early 2010:
• In January 2010, the FASB issued ASU 2010-6, Fair
Value Measurements and Disclosures (Topic 820),
Improving Disclosures About Fair Value
Measurements. This guidance provides amendments
to require new disclosures as follows: transfers in and
out of Levels 1 and 2 and the reasons for the
transfers, and additional breakout of asset and
liability categories. This guidance will be effective
for PNC for the first quarter 2010 reporting. This
guidance also requires purchases, sales, issuances and
settlements to be reported separately in the Level 3
rollforward. This additional guidance will be
effective for PNC beginning with the first quarter
2011 reporting.
S
TATUS
O
F
D
EFINED
B
ENEFIT
P
ENSION
P
LAN
We have a noncontributory, qualified defined benefit pension
plan (plan or pension plan) covering eligible employees.
Benefits are derived from cash balance formulas based on
compensation levels, age and length of service. Pension
contributions are based on an actuarially determined amount
necessary to fund total benefits payable to plan participants.
Consistent with our investment strategy, plan assets are
primarily invested in equity investments and fixed income
instruments. Plan fiduciaries determine and review the plan’s
63