PNC Bank 2009 Annual Report Download - page 93
Download and view the complete annual report
Please find page 93 of the 2009 PNC Bank annual report below. You can navigate through the pages in the report by either clicking on the pages listed below, or by using the keyword search tool below to find specific information within the annual report.-
 1
1 -
2
-
3
-
4
-
5
-
6
-
7
-
8
-
9
-
10
-
11
-
12
-
13
-
14
-
15
-
16
-
17
-
18
-
19
-
20
-
21
-
22
-
23
-
24
-
25
-
26
-
27
-
28
-
29
-
30
-
31
-
32
-
33
-
34
-
35
-
36
-
37
-
38
-
39
-
40
-
41
-
42
-
43
-
44
-
45
-
46
-
47
-
48
-
49
-
50
-
51
-
52
-
53
-
54
-
55
-
56
-
57
-
58
-
59
-
60
-
61
-
62
-
63
-
64
-
65
-
66
-
67
-
68
-
69
-
70
-
71
-
72
-
73
-
74
-
75
-
76
-
77
-
78
-
79
-
80
-
81
-
82
-
 83
83 -
 84
84 -
 85
85 -
 86
86 -
 87
87 -
 88
88 -
 89
89 -
 90
90 -
 91
91 -
 92
92 -
 93
93 -
 94
94 -
 95
95 -
 96
96 -
 97
97 -
 98
98 -
 99
99 -
 100
100 -
 101
101 -
 102
102 -
 103
103 -
104
-
105
-
106
-
107
-
108
-
109
-
110
-
111
-
112
-
113
-
114
-
115
-
116
-
117
-
118
-
119
-
120
-
121
-
122
-
123
-
124
-
125
-
126
-
127
-
128
-
129
-
130
-
131
-
132
-
133
-
134
-
135
-
136
-
137
-
138
-
139
-
140
-
141
-
142
-
143
-
144
-
145
-
146
-
147
-
148
-
149
-
150
-
151
-
152
-
153
-
154
-
155
-
156
-
157
-
158
-
159
-
160
-
161
-
162
-
163
-
164
-
165
-
166
-
167
-
168
-
169
-
170
-
171
-
172
-
173
-
174
-
175
-
176
-
177
-
178
-
179
-
180
-
181
-
182
-
183
-
184
-
185
-
186
-
187
-
188
-
189
-
190
-
191
-
192
-
193
-
194
-
195
-
196
 |
 |

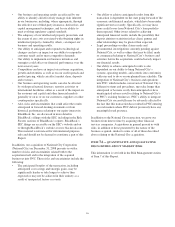
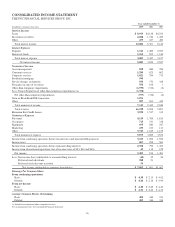
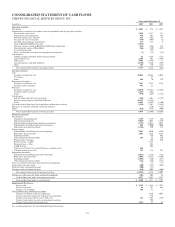
CONSOLIDATED BALANCE SHEET
THE PNC FINANCIAL SERVICES GROUP, INC.
In millions, except par value
December 31
2009
December 31
2008
Assets
Cash and due from banks $ 4,288 $ 4,471
Federal funds sold and resale agreements (includes $990 and $1,072 measured at fair value) (a) 2,390 1,856
Trading securities 2,124 1,725
Interest-earning deposits with banks 4,488 14,859
Loans held for sale (includes $2,062 and $1,400 measured at fair value) (a) 2,539 4,366
Investment securities 56,027 43,473
Loans (includes $88 measured at fair value at December 31, 2009) (a) 157,543 175,489
Allowance for loan and lease losses (5,072) (3,917)
Net loans 152,471 171,572
Goodwill 9,505 8,868
Other intangible assets 3,404 2,820
Equity investments 10,254 8,554
Other (includes $486 measured at fair value at December 31, 2009) (a) 22,373 28,517
Total assets $269,863 $291,081
Liabilities
Deposits
Noninterest-bearing $ 44,384 $ 37,148
Interest-bearing 142,538 155,717
Total deposits 186,922 192,865
Borrowed funds
Federal funds purchased and repurchase agreements 3,998 5,153
Federal Home Loan Bank borrowings 10,761 18,126
Bank notes and senior debt 12,362 13,664
Subordinated debt 9,907 11,208
Other 2,233 4,089
Total borrowed funds 39,261 52,240
Allowance for unfunded loan commitments and letters of credit 296 344
Accrued expenses 3,590 3,949
Other 7,227 14,035
Total liabilities 237,296 263,433
Equity
Preferred stock (b)
Common stock – $5 par value
Authorized 800 shares, issued 471 and 452 shares 2,354 2,261
Capital surplus – preferred stock 7,974 7,918
Capital surplus – common stock and other 8,945 8,328
Retained earnings (c) 13,144 11,461
Accumulated other comprehensive loss (c) (1,962) (3,949)
Common stock held in treasury at cost: 9 and 9 shares (513) (597)
Total shareholders’ equity 29,942 25,422
Noncontrolling interests 2,625 2,226
Total equity 32,567 27,648
Total liabilities and equity $269,863 $291,081
(a) Amounts represent items for which the Corporation has elected the fair value option.
(b) Par value less than $.5 million at each date.
(c) Retained earnings at January 1, 2009 was increased $110 million representing the after-tax noncredit portion of other-than-temporary impairment losses recognized in net income
during 2008 that has been reclassified to accumulated other comprehensive loss.
See accompanying Notes To Consolidated Financial Statements.
89