PNC Bank 2009 Annual Report Download - page 123
Download and view the complete annual report
Please find page 123 of the 2009 PNC Bank annual report below. You can navigate through the pages in the report by either clicking on the pages listed below, or by using the keyword search tool below to find specific information within the annual report.-
 1
1 -
2
-
3
-
4
-
5
-
6
-
7
-
8
-
9
-
10
-
11
-
12
-
13
-
14
-
15
-
16
-
17
-
18
-
19
-
20
-
21
-
22
-
23
-
24
-
25
-
26
-
27
-
28
-
29
-
30
-
31
-
32
-
33
-
34
-
35
-
36
-
37
-
38
-
39
-
40
-
41
-
42
-
43
-
44
-
45
-
46
-
47
-
48
-
49
-
50
-
51
-
52
-
53
-
54
-
55
-
56
-
57
-
58
-
59
-
60
-
61
-
62
-
63
-
64
-
65
-
66
-
67
-
68
-
69
-
70
-
71
-
72
-
73
-
74
-
75
-
76
-
77
-
78
-
79
-
80
-
81
-
82
-
83
-
84
-
85
-
86
-
87
-
88
-
89
-
90
-
91
-
92
-
93
-
94
-
95
-
96
-
97
-
98
-
99
-
100
-
101
-
102
-
103
-
104
-
105
-
106
-
107
-
108
-
109
-
110
-
111
-
112
-
 113
113 -
 114
114 -
 115
115 -
 116
116 -
 117
117 -
 118
118 -
 119
119 -
 120
120 -
 121
121 -
 122
122 -
 123
123 -
 124
124 -
 125
125 -
 126
126 -
 127
127 -
 128
128 -
 129
129 -
 130
130 -
 131
131 -
 132
132 -
 133
133 -
134
-
135
-
136
-
137
-
138
-
139
-
140
-
141
-
142
-
143
-
144
-
145
-
146
-
147
-
148
-
149
-
150
-
151
-
152
-
153
-
154
-
155
-
156
-
157
-
158
-
159
-
160
-
161
-
162
-
163
-
164
-
165
-
166
-
167
-
168
-
169
-
170
-
171
-
172
-
173
-
174
-
175
-
176
-
177
-
178
-
179
-
180
-
181
-
182
-
183
-
184
-
185
-
186
-
187
-
188
-
189
-
190
-
191
-
192
-
193
-
194
-
195
-
196
 |
 |

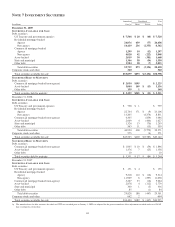
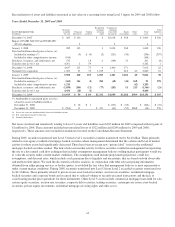
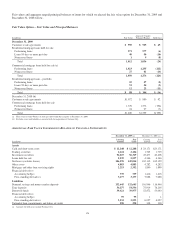
Reconciliations of assets and liabilities measured at fair value on a recurring basis using Level 3 inputs for 2009 and 2008 follow.
Years Ended December 31, 2009 and 2008
Level 3 Instruments Only
In millions
Securities
available
for sale
Financial
derivatives
Trading
securities
Residential
mortgage
servicing
rights
Commercial
mortgage
loans held
for sale (b)
Equity
investments
Other
assets
Total
assets
Total
liabilities
(c)
December 31, 2007 $ 285 $ 130 $ 4 $2,018 $ 568 $ 3,005 $ 326
Impact of FASB ASC 820 and FASB ASC
825-10 adoption 2 2 4
January 1, 2008 285 132 4 2,020 568 3,009 326
Total realized/unrealized gains or losses (a):
Included in earnings (*) (9) $ (4) (2) (251) (30) (296) (297)
Included in other comprehensive income (164) (164)
Purchases, issuances, and settlements, net 515 18 4 (369) 33 201 (8)
Transfers into Level 3, net 4,201 2 59 4,262 1
December 31, 2008 4,837 125 73 6 1,400 571 7,012 22
National City acquisition 1,063 35 32 1,019 1 610 40 2,800 16
January 1, 2009 5,900 160 105 1,025 1,401 1,181 40 9,812 38
Total realized/unrealized gains or losses (a):
Included in earnings (*) (563) 116 (2) 384 (68) (44) 268 91 278
Included in other comprehensive income 1,215 (12) 1,203
Purchases, issuances, and settlements, net (1,050) (206) (12) (77) (283) 51 213 (1,364) (21)
Transfers into Level 3, net 4,431 (20) (2) 4,409
December 31, 2009 $ 9,933 $ 50 $ 89 $1,332 $1,050 $1,188 $509 $14,151 $ 295
(*) Attributable to unrealized gains or losses
related to assets or liabilities held at:
December 31, 2008 $ 16 $ 1 $ (213) $ (50) $ (246) $ (37)
December 31, 2009 $ (563) 11 $ 351 (61) (52) $268 (46) 276
(a) Losses for assets are bracketed while losses for liabilities are not.
(b) Fair value option elected for this item.
(c) Financial derivatives.
Net losses (realized and unrealized) relating to Level 3 assets and liabilities were $187 million for 2009 compared with net gains of
$1 million for 2008. These amounts included net unrealized losses of $322 million and $209 million for 2009 and 2008,
respectively. These amounts were included in noninterest income on the Consolidated Income Statement.
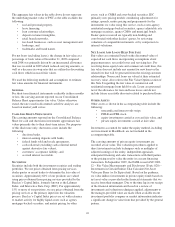
During 2009, securities transferred into Level 3 from Level 2 exceeded securities transferred out by $4.4 billion. These primarily
related to non-agency residential mortgage-backed securities where management determined that the volume and level of market
activity for these assets had significantly decreased. There have been no recent new “private label” issues in the residential
mortgage-backed securities market. The lack of relevant market activity for these securities resulted in management incorporating
the use of a discounted cash flow technique that includes assumptions management believes willing market participants would use
to value the security under current market conditions. The assumptions used include prepayment projections, credit loss
assumptions, and discount rates, which include a risk premium due to liquidity and uncertainty, that are based on both observable
and unobservable inputs. We used the discounted cash flow analysis, in conjunction with other relevant pricing information
obtained from either pricing services or broker quotes, to establish the fair value that management believes is most representative
under current market conditions. During 2008, securities transferred into Level 3 from Level 2 exceeded securities transferred out
by $4.3 billion. These primarily related to private issuer asset-backed securities, auction rate securities, residential mortgage-
backed securities and corporate bonds and occurred due to reduced volume of recently executed transactions and the lack of
corroborating market price quotations for these instruments. Other Level 3 assets include commercial mortgage loans held for sale,
certain equity securities, auction rate securities, corporate debt securities, trading securities, certain private-issuer asset-backed
securities, private equity investments, residential mortgage servicing rights and other assets.
119