PNC Bank 2009 Annual Report Download - page 24
Download and view the complete annual report
Please find page 24 of the 2009 PNC Bank annual report below. You can navigate through the pages in the report by either clicking on the pages listed below, or by using the keyword search tool below to find specific information within the annual report.-
 1
1 -
2
-
3
-
4
-
5
-
6
-
7
-
8
-
9
-
10
-
11
-
12
-
13
-
 14
14 -
 15
15 -
 16
16 -
 17
17 -
 18
18 -
 19
19 -
 20
20 -
 21
21 -
 22
22 -
 23
23 -
 24
24 -
 25
25 -
 26
26 -
 27
27 -
 28
28 -
 29
29 -
 30
30 -
 31
31 -
 32
32 -
 33
33 -
 34
34 -
35
-
36
-
37
-
38
-
39
-
40
-
41
-
42
-
43
-
44
-
45
-
46
-
47
-
48
-
49
-
50
-
51
-
52
-
53
-
54
-
55
-
56
-
57
-
58
-
59
-
60
-
61
-
62
-
63
-
64
-
65
-
66
-
67
-
68
-
69
-
70
-
71
-
72
-
73
-
74
-
75
-
76
-
77
-
78
-
79
-
80
-
81
-
82
-
83
-
84
-
85
-
86
-
87
-
88
-
89
-
90
-
91
-
92
-
93
-
94
-
95
-
96
-
97
-
98
-
99
-
100
-
101
-
102
-
103
-
104
-
105
-
106
-
107
-
108
-
109
-
110
-
111
-
112
-
113
-
114
-
115
-
116
-
117
-
118
-
119
-
120
-
121
-
122
-
123
-
124
-
125
-
126
-
127
-
128
-
129
-
130
-
131
-
132
-
133
-
134
-
135
-
136
-
137
-
138
-
139
-
140
-
141
-
142
-
143
-
144
-
145
-
146
-
147
-
148
-
149
-
150
-
151
-
152
-
153
-
154
-
155
-
156
-
157
-
158
-
159
-
160
-
161
-
162
-
163
-
164
-
165
-
166
-
167
-
168
-
169
-
170
-
171
-
172
-
173
-
174
-
175
-
176
-
177
-
178
-
179
-
180
-
181
-
182
-
183
-
184
-
185
-
186
-
187
-
188
-
189
-
190
-
191
-
192
-
193
-
194
-
195
-
196
 |
 |

ITEM
6–
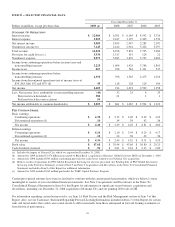
SELECTED FINANCIAL DATA
Year ended December 31
Dollars in millions, except per share data 2009 (a) 2008 2007 2006 2005
S
UMMARY
O
F
O
PERATIONS
Interest income $ 12,086 $ 6,301 $ 6,144 $ 4,592 $ 3,720
Interest expense 3,003 2,447 3,197 2,309 1,533
Net interest income 9,083 3,854 2,947 2,283 2,187
Noninterest income (b) 7,145 2,442 2,944 5,422 3,297
Total revenue 16,228 6,296 5,891 7,705 5,484
Provision for credit losses (c) 3,930 1,517 315 124 21
Noninterest expense 9,073 3,685 3,652 3,795 3,662
Income from continuing operations before income taxes and
noncontrolling interests 3,225 1,094 1,924 3,786 1,801
Income taxes 867 298 561 1,311 547
Income from continuing operations before
noncontrolling interests 2,358 796 1,363 2,475 1,254
Income from discontinued operations (net of income taxes of
$54, $63, $66, $52 and $57) (d) 45 118 128 124 104
Net income 2,403 914 1,491 2,599 1,358
Less: Net income (loss) attributable to noncontrolling interests (44) 32 24 4 33
Preferred stock dividends (e) 388 21 1 1
Preferred stock discount accretion 56
Net income attributable to common shareholders $ 2,003 $ 861 $ 1,467 $ 2,594 $ 1,324
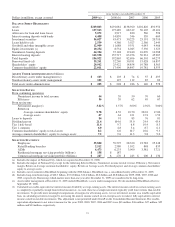
P
ER
C
OMMON
S
HARE
Basic earnings
Continuing operations $ 4.30 $ 2.15 $ 4.02 $ 8.39 $ 4.24
Discontinued operations (d) .10 .34 .38 .42 .36
Net income $ 4.40 $ 2.49 $ 4.40 $ 8.81 $ 4.60
Diluted earnings
Continuing operations $ 4.26 $ 2.10 $ 3.94 $ 8.29 $ 4.17
Discontinued operations (d) .10 .34 .38 .42 .36
Net income $ 4.36 $ 2.44 $ 4.32 $ 8.71 $ 4.53
Book value $ 47.68 $ 39.44 $ 43.60 $ 36.80 $ 29.21
Cash dividends declared $ .96 $ 2.61 $ 2.44 $ 2.15 $ 2.00
(a) Includes the impact of National City, which we acquired on December 31, 2008.
(b) Amount for 2009 included $1.076 billion gain related to BlackRock’s acquisition of Barclays Global Investors (BGI) on December 1, 2009.
(c) Amount for 2008 included $504 million conforming provision for credit losses related to our National City acquisition.
(d) Reflects results of operations for PNC Global Investment Servicing for all years presented. See Pending Sale of PNC Global Investment
Servicing in the Executive Summary section of Item 7 and Note 2 Acquisitions and Divestitures in the Notes To Consolidated Financial
Statements included in Item 8 of this Report for additional information.
(e) Amount for 2009 included $332 million paid under the TARP Capital Purchase Program.
Certain prior-period amounts have been reclassified to conform with the current period presentation, which we believe is more
meaningful to readers of our consolidated financial statements. See Note 2 Acquisitions and Divestitures in the Notes To
Consolidated Financial Statements in Item 8 of this Report for information on significant recent business acquisitions and
divestitures, including our December 31, 2008 acquisition of National City and our pending 2010 sale of GIS.
For information regarding certain business risks, see Item 1A Risk Factors and the Risk Management section of Item 7 of this
Report. Also, see our Cautionary Statement Regarding Forward-Looking Information included in Item 7 of this Report for certain
risks and uncertainties that could cause actual results to differ materially from those anticipated in forward-looking statements or
from historical performance.
20