PNC Bank 2009 Annual Report Download - page 177
Download and view the complete annual report
Please find page 177 of the 2009 PNC Bank annual report below. You can navigate through the pages in the report by either clicking on the pages listed below, or by using the keyword search tool below to find specific information within the annual report.-
 1
1 -
2
-
3
-
4
-
5
-
6
-
7
-
8
-
9
-
10
-
11
-
12
-
13
-
14
-
15
-
16
-
17
-
18
-
19
-
20
-
21
-
22
-
23
-
24
-
25
-
26
-
27
-
28
-
29
-
30
-
31
-
32
-
33
-
34
-
35
-
36
-
37
-
38
-
39
-
40
-
41
-
42
-
43
-
44
-
45
-
46
-
47
-
48
-
49
-
50
-
51
-
52
-
53
-
54
-
55
-
56
-
57
-
58
-
59
-
60
-
61
-
62
-
63
-
64
-
65
-
66
-
67
-
68
-
69
-
70
-
71
-
72
-
73
-
74
-
75
-
76
-
77
-
78
-
79
-
80
-
81
-
82
-
83
-
84
-
85
-
86
-
87
-
88
-
89
-
90
-
91
-
92
-
93
-
94
-
95
-
96
-
97
-
98
-
99
-
100
-
101
-
102
-
103
-
104
-
105
-
106
-
107
-
108
-
109
-
110
-
111
-
112
-
113
-
114
-
115
-
116
-
117
-
118
-
119
-
120
-
121
-
122
-
123
-
124
-
125
-
126
-
127
-
128
-
129
-
130
-
131
-
132
-
133
-
134
-
135
-
136
-
137
-
138
-
139
-
140
-
141
-
142
-
143
-
144
-
145
-
146
-
147
-
148
-
149
-
150
-
151
-
152
-
153
-
154
-
155
-
156
-
157
-
158
-
159
-
160
-
161
-
162
-
163
-
164
-
165
-
166
-
 167
167 -
 168
168 -
 169
169 -
 170
170 -
 171
171 -
 172
172 -
 173
173 -
 174
174 -
 175
175 -
 176
176 -
 177
177 -
 178
178 -
 179
179 -
 180
180 -
 181
181 -
 182
182 -
 183
183 -
 184
184 -
 185
185 -
 186
186 -
 187
187 -
188
-
189
-
190
-
191
-
192
-
193
-
194
-
195
-
196
 |
 |

S
UMMARY
O
F
L
OAN
L
OSS
E
XPERIENCE
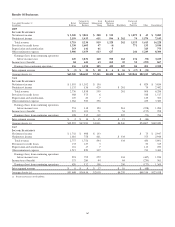
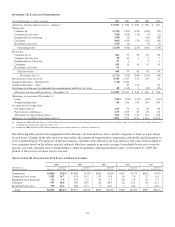
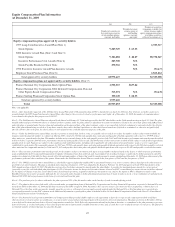
Year ended December 31 - dollars in millions 2009 2008 2007 2006 2005
Allowance for loan and lease losses – January 1 $ 3,917 $ 830 $ 560 $ 596 $ 607
Charge-offs
Commercial (1,276) (301) (156) (108) (52)
Commercial real estate (510) (165) (16) (3) (1)
Equipment lease financing (149) (3) (14) (29)
Consumer (961) (143) (73) (52) (45)
Residential real estate (259) (6) (3) (2)
Total charge-offs (3,155) (618) (245) (180) (129)
Recoveries
Commercial (a) 181 53 30 19 82
Commercial real estate 38 1011 1
Equipment lease financing 27 151
Consumer 105 15 14 15 15
Residential real estate 93
Total recoveries 444 79 45 40 99
Net charge-offs (a) (2,711) (539) (200) (140) (30)
Provision for credit losses (b) 3,930 1,517 315 124 21
Acquired allowance – National City (112) 2,224
Acquired allowance – other 20 152 23
Net change in allowance for unfunded loan commitments and letters of credit 48 (135) 3 (20) (25)
Allowance for loan and lease losses – December 31 $ 5,072 $3,917 $ 830 $ 560 $ 596
Allowance as a percent of December 31:
Loans 3.22% 2.23% 1.21% 1.12% 1.21%
Nonperforming loans 89 236 183 350 299
As a percent of average loans
Net charge-offs (a) 1.64 .74 .32 .28 .06
Provision for credit losses 2.37 2.09 .50 .25 .04
Allowance for loan and lease losses 3.06 5.38 1.33 1.13 1.26
Allowance as a multiple of net charge-offs (a) 1.87x 7.27x 4.15x 4.00x 19.87x
(a) Amounts for 2005 reflect the impact of a $53 million loan recovery in that year. Excluding this recovery, net charge-offs would have been .18% of average loans and the allowance as
a multiple of net charge-offs would have been 7.18x.
(b) Amount for 2008 included a $504 million conforming provision for credit losses related to National City.
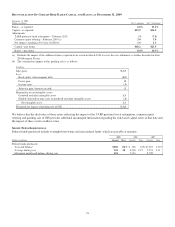
The following table presents the assignment of the allowance for loan and lease losses and the categories of loans as a percentage
of total loans. Changes in the allocation over time reflect the changes in loan portfolio composition, risk profile and refinements to
reserve methodologies. For purposes of this presentation, a portion of the allowance for loan and lease losses has been assigned to
loan categories based on the relative specific and pool allocation amounts to provide coverage for probable losses not covered in
specific, pool and consumer reserve methodologies related to qualitative and measurement factors. At December 31, 2009, the
portion of the reserves for these factors was zero.
A
LLOCATION
O
F
A
LLOWANCE
F
OR
L
OAN AND
L
EASE
L
OSSES
2009 2008 2007 2006 2005
December 31
Dollars in millions Allowance
Loans to
Total Loans Allowance
Loans to
Total Loans Allowance
Loans to
Total Loans Allowance
Loans to
Total Loans Allowance
Loans to
Total Loans
Commercial $1,869 34.8% $1,668 39.4% $564 42.4% $447 41.7% $492 39.9%
Commercial real estate 1,305 14.7 833 14.7 153 13.0 30 7.0 32 6.4
Equipment lease financing 171 3.9 179 3.7 36 3.7 48 5.6 41 5.7
Consumer 957 34.0 929 29.9 68 26.9 28 33.1 24 33.1
Residential real estate 770 12.6 308 12.3 9 14.0 7 12.6 7 14.9
Total $5,072 100.0% $3,917 100.0% $830 100.0% $560 100.0% $596 100.0%
173