PNC Bank 2009 Annual Report Download - page 30
Download and view the complete annual report
Please find page 30 of the 2009 PNC Bank annual report below. You can navigate through the pages in the report by either clicking on the pages listed below, or by using the keyword search tool below to find specific information within the annual report.-
 1
1 -
2
-
3
-
4
-
5
-
6
-
7
-
8
-
9
-
10
-
11
-
12
-
13
-
14
-
15
-
16
-
17
-
18
-
19
-
 20
20 -
 21
21 -
 22
22 -
 23
23 -
 24
24 -
 25
25 -
 26
26 -
 27
27 -
 28
28 -
 29
29 -
 30
30 -
 31
31 -
 32
32 -
 33
33 -
 34
34 -
 35
35 -
 36
36 -
 37
37 -
 38
38 -
 39
39 -
 40
40 -
41
-
42
-
43
-
44
-
45
-
46
-
47
-
48
-
49
-
50
-
51
-
52
-
53
-
54
-
55
-
56
-
57
-
58
-
59
-
60
-
61
-
62
-
63
-
64
-
65
-
66
-
67
-
68
-
69
-
70
-
71
-
72
-
73
-
74
-
75
-
76
-
77
-
78
-
79
-
80
-
81
-
82
-
83
-
84
-
85
-
86
-
87
-
88
-
89
-
90
-
91
-
92
-
93
-
94
-
95
-
96
-
97
-
98
-
99
-
100
-
101
-
102
-
103
-
104
-
105
-
106
-
107
-
108
-
109
-
110
-
111
-
112
-
113
-
114
-
115
-
116
-
117
-
118
-
119
-
120
-
121
-
122
-
123
-
124
-
125
-
126
-
127
-
128
-
129
-
130
-
131
-
132
-
133
-
134
-
135
-
136
-
137
-
138
-
139
-
140
-
141
-
142
-
143
-
144
-
145
-
146
-
147
-
148
-
149
-
150
-
151
-
152
-
153
-
154
-
155
-
156
-
157
-
158
-
159
-
160
-
161
-
162
-
163
-
164
-
165
-
166
-
167
-
168
-
169
-
170
-
171
-
172
-
173
-
174
-
175
-
176
-
177
-
178
-
179
-
180
-
181
-
182
-
183
-
184
-
185
-
186
-
187
-
188
-
189
-
190
-
191
-
192
-
193
-
194
-
195
-
196
 |
 |

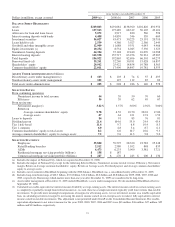
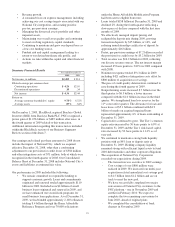
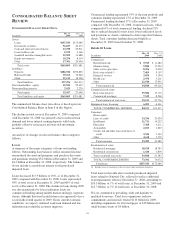
Our Consolidated Income Statement Review and Consolidated
Balance Sheet Review sections of this Item 7 describe in
greater detail the various items that impacted our results for
2009 and 2008.
L
INE OF
B
USINESS
H
IGHLIGHTS
In the first quarter of 2009, we made changes to our business
organization structure and management reporting in
conjunction with the acquisition of National City.
Business segment results for 2008 and 2007 in this Report
have been reclassified to reflect current methodologies and
current business and management structure and to present all
periods on the same basis. As a result of its pending sale, GIS
is no longer a reportable business segment.
Results for 2009 for all of our business segments except
BlackRock reflect the impact of revenues and expenses
associated with businesses acquired with National City.
Highlights of results for 2009 and 2008 are included below.
We refer you to Item 1 of this Report under the captions
Business Overview and Review of Lines of Business for an
overview of our business segments and to the Business
Segments Review section of this Item 7 for a Results Of
Businesses – Summary table and further analysis of business
segment results for 2009 and 2008, including presentation
differences from Note 27 Segment Reporting in the Notes To
Consolidated Financial Statements in Item 8 of this Report.
We provide a reconciliation of total business segment earnings
to PNC consolidated income from continuing operations as
reported on a GAAP basis in Note 27.
Retail Banking
Retail Banking’s earnings were $136 million for 2009
compared with $328 million for 2008. Results were
challenged in this environment by increased credit costs,
lower interest credits assigned to the segment’s deposits,
reduced consumer spending and increased FDIC insurance
costs. Pre-tax, pre-provision earnings were $1.6 billion for
2009, a 65% increase over 2008. Retail Banking continues to
maintain its focus on customer, loan and deposit growth,
employee and customer satisfaction, investing in the business
for future growth, as well as disciplined expense management
during this period of market and economic uncertainty.
Corporate & Institutional Banking
Corporate & Institutional Banking earned $1.2 billion in 2009
compared with $215 million in 2008. The acquisition of
National City positively impacted operating results as
revenues nearly tripled while noninterest expense
approximately doubled. As a result, operating leverage of $2.6
billion more than offset a $1.0 billion increase in the provision
for credit losses.
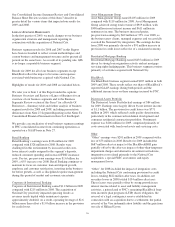
Asset Management Group
Asset Management Group earned $105 million for 2009
compared with $119 million for 2008. Asset Management
Group achieved strong total revenue of $919 million, with
$308 million in net interest income and $611 million in
noninterest income. The business increased pretax,
pre-provision earnings by $69 million or 35% over 2008, as
the business grew clients, managed expenses and successfully
executed the National City integration. The earnings decline
from 2008 was primarily driven by a $91 million increase in
provision for credit losses reflective of a weakened economy.
Residential Mortgage Banking
Residential Mortgage Banking earned $435 million in 2009
driven by strong loan origination activity and net mortgage
servicing rights hedging gains. This business segment consists
primarily of activities acquired with National City.
BlackRock
Our BlackRock business segment earned $207 million in both
2009 and 2008. These results reflect our share of BlackRock’s
reported GAAP earnings during both periods and the
additional income taxes on these earnings incurred by PNC.
Distressed Assets Portfolio
The Distressed Assets Portfolio had earnings of $84 million
for 2009. Earnings were largely driven by net interest income
of $1.1 billion. The provision for credit losses was $771
million in 2009, which reflected credit quality deterioration,
particularly in the commercial residential development and
consumer residential construction portfolios. Noninterest
expense was $246 million for 2009, comprised primarily of
costs associated with foreclosed assets and servicing costs.
Other
“Other” earnings were $201 million in 2009 compared with a
loss of $73 million in 2008. Results for 2009 included the
$687 million after-tax impact of the BlackRock/BGI gain
partially offset by the after-tax impact of other-than-temporary
impairment charges and alternative investment writedowns,
integration costs related primarily to the National City
acquisition, a special FDIC assessment, and equity
management losses.
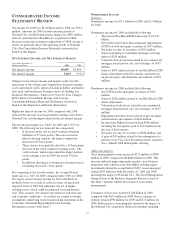
“Other” for 2008 included the impact of integration costs,
including the National City conforming provision for credit
losses, totaling $422 million after taxes. In addition, net
securities losses in 2008 totaled $134 million after taxes.
These factors were partially offset by strong growth in net
interest income related to asset and liability management
activities, a gain related to PNC’s remaining BlackRock long-
term incentive plan programs (LTIP) shares obligation, the
reversal of a legal contingency reserve established in
connection with an acquisition due to a settlement, the partial
reversal of the Visa indemnification liability and the gain from
our sale of Hilliard Lyons.
26