PNC Bank 2009 Annual Report Download - page 114
Download and view the complete annual report
Please find page 114 of the 2009 PNC Bank annual report below. You can navigate through the pages in the report by either clicking on the pages listed below, or by using the keyword search tool below to find specific information within the annual report.-
 1
1 -
2
-
3
-
4
-
5
-
6
-
7
-
8
-
9
-
10
-
11
-
12
-
13
-
14
-
15
-
16
-
17
-
18
-
19
-
20
-
21
-
22
-
23
-
24
-
25
-
26
-
27
-
28
-
29
-
30
-
31
-
32
-
33
-
34
-
35
-
36
-
37
-
38
-
39
-
40
-
41
-
42
-
43
-
44
-
45
-
46
-
47
-
48
-
49
-
50
-
51
-
52
-
53
-
54
-
55
-
56
-
57
-
58
-
59
-
60
-
61
-
62
-
63
-
64
-
65
-
66
-
67
-
68
-
69
-
70
-
71
-
72
-
73
-
74
-
75
-
76
-
77
-
78
-
79
-
80
-
81
-
82
-
83
-
84
-
85
-
86
-
87
-
88
-
89
-
90
-
91
-
92
-
93
-
94
-
95
-
96
-
97
-
98
-
99
-
100
-
101
-
102
-
103
-
 104
104 -
 105
105 -
 106
106 -
 107
107 -
 108
108 -
 109
109 -
 110
110 -
 111
111 -
 112
112 -
 113
113 -
 114
114 -
 115
115 -
 116
116 -
 117
117 -
 118
118 -
 119
119 -
 120
120 -
 121
121 -
 122
122 -
 123
123 -
 124
124 -
125
-
126
-
127
-
128
-
129
-
130
-
131
-
132
-
133
-
134
-
135
-
136
-
137
-
138
-
139
-
140
-
141
-
142
-
143
-
144
-
145
-
146
-
147
-
148
-
149
-
150
-
151
-
152
-
153
-
154
-
155
-
156
-
157
-
158
-
159
-
160
-
161
-
162
-
163
-
164
-
165
-
166
-
167
-
168
-
169
-
170
-
171
-
172
-
173
-
174
-
175
-
176
-
177
-
178
-
179
-
180
-
181
-
182
-
183
-
184
-
185
-
186
-
187
-
188
-
189
-
190
-
191
-
192
-
193
-
194
-
195
-
196
 |
 |

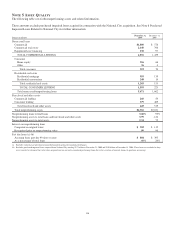
N
OTE
5A
SSET
Q
UALITY
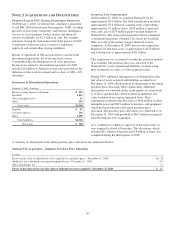
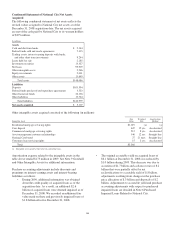
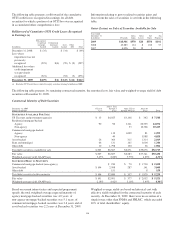
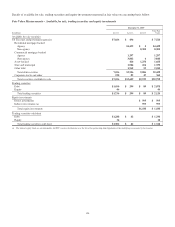
The following table sets forth nonperforming assets and related information.
These amounts exclude purchased impaired loans acquired in connection with the National City acquisition. See Note 6 Purchased
Impaired Loans Related to National City for further information.
Dollars in millions
December 31,
2009
December 31,
2008
Nonaccrual loans
Commercial $1,806 $ 576
Commercial real estate 2,140 766
Equipment lease financing 130 97
TOTAL COMMERCIAL LENDING 4,076 1,439
Consumer
Home equity 356 66
Other 36 4
Total consumer 392 70
Residential real estate
Residential mortgage 955 139
Residential construction 248 14
Total residential real estate 1,203 153
TOTAL CONSUMER LENDING 1,595 223
Total nonaccrual/nonperforming loans 5,671 1,662
Foreclosed and other assets
Commercial lending 266 50
Consumer lending 379 469
Total foreclosed and other assets 645 519
Total nonperforming assets $6,316 $2,181
Nonperforming loans to total loans 3.60% .95%
Nonperforming assets to total loans and foreclosed and other assets 3.99 1.24
Nonperforming assets to total assets 2.34 .75
Interest on nonperforming loans
Computed on original terms $ 302 $ 115
Recognized prior to nonperforming status 90 60
Past due loans (a) (b)
Accruing loans past due 90 days or more $ 884 $ 395
As a percentage of total loans .60% .24%
(a) Excludes loans that are government insured/guaranteed, primarily residential mortgages.
(b) Excludes purchased impaired loans acquired from National City totaling $2.7 billion at December 31, 2009 and $2.0 billion at December 31, 2008. These loans are excluded as they
were recorded at estimated fair value when acquired and are currently considered performing loans due to the accretion of interest income in purchase accounting.
110