PNC Bank 2009 Annual Report Download - page 53
Download and view the complete annual report
Please find page 53 of the 2009 PNC Bank annual report below. You can navigate through the pages in the report by either clicking on the pages listed below, or by using the keyword search tool below to find specific information within the annual report.-
 1
1 -
2
-
3
-
4
-
5
-
6
-
7
-
8
-
9
-
10
-
11
-
12
-
13
-
14
-
15
-
16
-
17
-
18
-
19
-
20
-
21
-
22
-
23
-
24
-
25
-
26
-
27
-
28
-
29
-
30
-
31
-
32
-
33
-
34
-
35
-
36
-
37
-
38
-
39
-
40
-
41
-
42
-
 43
43 -
 44
44 -
 45
45 -
 46
46 -
 47
47 -
 48
48 -
 49
49 -
 50
50 -
 51
51 -
 52
52 -
 53
53 -
 54
54 -
 55
55 -
 56
56 -
 57
57 -
 58
58 -
 59
59 -
 60
60 -
 61
61 -
 62
62 -
 63
63 -
64
-
65
-
66
-
67
-
68
-
69
-
70
-
71
-
72
-
73
-
74
-
75
-
76
-
77
-
78
-
79
-
80
-
81
-
82
-
83
-
84
-
85
-
86
-
87
-
88
-
89
-
90
-
91
-
92
-
93
-
94
-
95
-
96
-
97
-
98
-
99
-
100
-
101
-
102
-
103
-
104
-
105
-
106
-
107
-
108
-
109
-
110
-
111
-
112
-
113
-
114
-
115
-
116
-
117
-
118
-
119
-
120
-
121
-
122
-
123
-
124
-
125
-
126
-
127
-
128
-
129
-
130
-
131
-
132
-
133
-
134
-
135
-
136
-
137
-
138
-
139
-
140
-
141
-
142
-
143
-
144
-
145
-
146
-
147
-
148
-
149
-
150
-
151
-
152
-
153
-
154
-
155
-
156
-
157
-
158
-
159
-
160
-
161
-
162
-
163
-
164
-
165
-
166
-
167
-
168
-
169
-
170
-
171
-
172
-
173
-
174
-
175
-
176
-
177
-
178
-
179
-
180
-
181
-
182
-
183
-
184
-
185
-
186
-
187
-
188
-
189
-
190
-
191
-
192
-
193
-
194
-
195
-
196
 |
 |

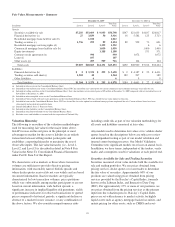
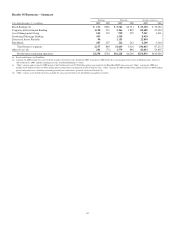
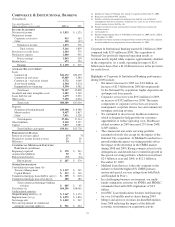
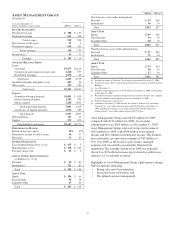
Results Of Businesses – Summary
Year ended December 31 - in millions
Earnings Revenue Average Assets (a)
2009 2008 2009 2008 2009 2008
Retail Banking (b) $ 136 $328 $ 5,721 $2,731 $ 65,320 $ 32,922
Corporate & Institutional Banking 1,190 215 5,266 1,859 84,689 47,050
Asset Management Group 105 119 919 559 7,341 3,001
Residential Mortgage Banking 435 1,328 8,420
Distressed Assets Portfolio 84 1,153 22,844
BlackRock 207 207 262 261 6,249 4,240
Total business segments 2,157 869 14,469 5,410 194,863 87,213
Other (b) (c) (d) 201 (73) 1,579 886 82,013 54,807
Results from continuing operations $2,358 $796 $16,228 $6,296 $276,876 $142,020
(a) Period-end balances for BlackRock.
(b) Amounts for 2009 include the results of the 61 branches divested by early September 2009. Amounts for 2008 reflect the reclassification of the results of Hilliard Lyons, which we
sold on March 31, 2008, and the related gain on sale, from Retail Banking to “Other.”
(c) “Other” earnings and revenue for 2009 include a $687 million after-tax ($1.076 billion pretax) gain related to the BlackRock/BGI transaction and “Other” earnings for 2009 also
includes $274 million of after-tax ($421 million pretax) integration costs primarily related to National City. “Other” earnings for 2008 includes $422 million of after-tax ($649 million
pretax) integration costs, including conforming provision for credit losses, primarily related to National City.
(d) “Other” average assets include securities available for sale associated with asset and liability management activities.
49