PNC Bank 2009 Annual Report Download - page 126
Download and view the complete annual report
Please find page 126 of the 2009 PNC Bank annual report below. You can navigate through the pages in the report by either clicking on the pages listed below, or by using the keyword search tool below to find specific information within the annual report.-
 1
1 -
2
-
3
-
4
-
5
-
6
-
7
-
8
-
9
-
10
-
11
-
12
-
13
-
14
-
15
-
16
-
17
-
18
-
19
-
20
-
21
-
22
-
23
-
24
-
25
-
26
-
27
-
28
-
29
-
30
-
31
-
32
-
33
-
34
-
35
-
36
-
37
-
38
-
39
-
40
-
41
-
42
-
43
-
44
-
45
-
46
-
47
-
48
-
49
-
50
-
51
-
52
-
53
-
54
-
55
-
56
-
57
-
58
-
59
-
60
-
61
-
62
-
63
-
64
-
65
-
66
-
67
-
68
-
69
-
70
-
71
-
72
-
73
-
74
-
75
-
76
-
77
-
78
-
79
-
80
-
81
-
82
-
83
-
84
-
85
-
86
-
87
-
88
-
89
-
90
-
91
-
92
-
93
-
94
-
95
-
96
-
97
-
98
-
99
-
100
-
101
-
102
-
103
-
104
-
105
-
106
-
107
-
108
-
109
-
110
-
111
-
112
-
113
-
114
-
115
-
 116
116 -
 117
117 -
 118
118 -
 119
119 -
 120
120 -
 121
121 -
 122
122 -
 123
123 -
 124
124 -
 125
125 -
 126
126 -
 127
127 -
 128
128 -
 129
129 -
 130
130 -
 131
131 -
 132
132 -
 133
133 -
 134
134 -
 135
135 -
 136
136 -
137
-
138
-
139
-
140
-
141
-
142
-
143
-
144
-
145
-
146
-
147
-
148
-
149
-
150
-
151
-
152
-
153
-
154
-
155
-
156
-
157
-
158
-
159
-
160
-
161
-
162
-
163
-
164
-
165
-
166
-
167
-
168
-
169
-
170
-
171
-
172
-
173
-
174
-
175
-
176
-
177
-
178
-
179
-
180
-
181
-
182
-
183
-
184
-
185
-
186
-
187
-
188
-
189
-
190
-
191
-
192
-
193
-
194
-
195
-
196
 |
 |

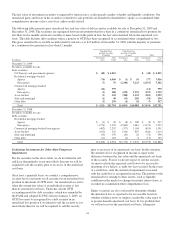
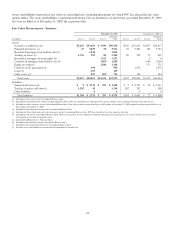
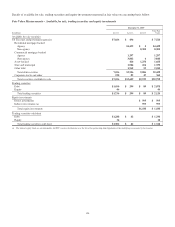
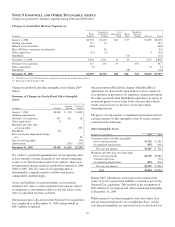
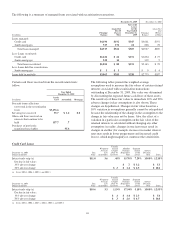
Fair Value Measurements – Nonrecurring (a)
Fair Value
Gains (Losses)
Year ended
In millions
December 31
2009
December 31
2008
December 31
2009
December 31
2008
Assets
Nonaccrual loans $ 939 $250 $(365) $ (99)
Loans held for sale 168 101 4(2)
Equity investments (b) 154 75 (64) (73)
Commercial mortgage servicing rights (c) 560 (35)
Other intangible assets 1
Other assets (d) 138 (50)
Total assets $1,400 $986 $(475) $(209)
(a) All Level 3 except $5 million in loans held for sale which are Level 2 at December 31, 2009.
(b) Includes LIHTC and other equity investments.
(c) No strata at fair value at December 31, 2009 and two strata at December 31, 2008. During 2009, we recorded a $35 million recovery of previous impairment on commercial mortgage
servicing rights. Refer to Note 9 Goodwill and Other Intangible Assets for additional information.
(d) Principally other real estate owned.
Fair Value Option
Commercial Mortgage Loans Held for Sale
We account for certain commercial mortgage loans classified
as held for sale at fair value. The election of the fair value
option aligns the accounting for the commercial mortgages
with the related hedges. At origination, these loans were
intended for securitization. Due to inactivity in the CMBS
securitization market in 2009 and 2008, we determined the
fair value of commercial mortgage loans held for sale by using
a whole loan methodology. Fair value was determined using
assumptions that management believed a market participant
would use in pricing the loans. When available, valuation
assumptions included observable inputs based on whole loan
sales. Adjustments were made to these assumptions when
uncertainties exist, including market conditions and liquidity.
Credit risk is included as part of our valuation process for
these loans by considering expected rates of return for market
participants for similar loans in the marketplace. Based on the
significance of unobservable inputs, we classify this portfolio
as Level 3.
At December 31, 2009, commercial mortgage loans held for
sale for which we elected the fair value option had an
aggregate fair value of $1.1 billion and an aggregate
outstanding principal balance of $1.3 billion. The comparable
amounts at December 31, 2008 were $1.4 billion and $1.6
billion, respectively.
Interest income on these loans is recorded as earned and
reported on the Consolidated Income Statement in other
interest income. Net losses resulting from
changes in fair value of these loans of $68 million in 2009 and
$251 million for 2008 were recorded in other noninterest
income. The impact on earnings of offsetting economic
hedges is not reflected in these amounts. Changes in fair value
due to instrument-specific credit risk for 2009 and 2008 were
not material. The changes in fair value of these loans were
partially offset by changes in the fair value of the related
financial derivatives that economically hedged these loans.
Residential Mortgage Loans Held for Sale
We have elected to account for certain residential mortgage
loans originated for sale at fair value on a recurring basis. As
of December 31, 2009, all residential mortgage loans held for
sale were at fair value. Residential mortgage loans are valued
based on quoted market prices, where available, prices for
other traded mortgage loans with similar characteristics, and
purchase commitments and bid information received from
market participants. These loans are regularly traded in active
markets and observable pricing information is available from
market participants. The prices are adjusted as necessary to
include the embedded servicing value in the loans and to take
into consideration the specific characteristics of certain loans
that are priced based on the pricing of similar loans. These
adjustments represent unobservable inputs to the valuation but
are not considered significant to the fair value of the loans.
Accordingly, residential mortgage loans held for sale are
classified as Level 2.
At December 31, 2009, residential mortgage loans held for
sale for which we elected the fair value option had an
aggregate fair value and outstanding principal balance of
$1.0 billion. Throughout 2009, certain residential mortgage
loans for which we elected the fair value option were
subsequently reclassified to portfolio loans. Changes in fair
value due to instrument-specific credit risk for 2009 was not
material. At December 31, 2009, residential mortgage loans
held in portfolio had a total fair value of $88 million and a
total outstanding principal balance of $104 million.
Customer Resale Agreements and Bank Notes
We have elected to account for structured resale agreements
and structured bank notes, which are economically hedged
using free-standing financial derivatives at fair value.
The fair value for structured resale agreements and structured
bank notes is determined using a model which includes
observable market data as inputs such as interest rates.
Readily observable market inputs to this model can be
122