PNC Bank 2009 Annual Report Download - page 35
Download and view the complete annual report
Please find page 35 of the 2009 PNC Bank annual report below. You can navigate through the pages in the report by either clicking on the pages listed below, or by using the keyword search tool below to find specific information within the annual report.-
 1
1 -
2
-
3
-
4
-
5
-
6
-
7
-
8
-
9
-
10
-
11
-
12
-
13
-
14
-
15
-
16
-
17
-
18
-
19
-
20
-
21
-
22
-
23
-
24
-
 25
25 -
 26
26 -
 27
27 -
 28
28 -
 29
29 -
 30
30 -
 31
31 -
 32
32 -
 33
33 -
 34
34 -
 35
35 -
 36
36 -
 37
37 -
 38
38 -
 39
39 -
 40
40 -
 41
41 -
 42
42 -
 43
43 -
 44
44 -
 45
45 -
46
-
47
-
48
-
49
-
50
-
51
-
52
-
53
-
54
-
55
-
56
-
57
-
58
-
59
-
60
-
61
-
62
-
63
-
64
-
65
-
66
-
67
-
68
-
69
-
70
-
71
-
72
-
73
-
74
-
75
-
76
-
77
-
78
-
79
-
80
-
81
-
82
-
83
-
84
-
85
-
86
-
87
-
88
-
89
-
90
-
91
-
92
-
93
-
94
-
95
-
96
-
97
-
98
-
99
-
100
-
101
-
102
-
103
-
104
-
105
-
106
-
107
-
108
-
109
-
110
-
111
-
112
-
113
-
114
-
115
-
116
-
117
-
118
-
119
-
120
-
121
-
122
-
123
-
124
-
125
-
126
-
127
-
128
-
129
-
130
-
131
-
132
-
133
-
134
-
135
-
136
-
137
-
138
-
139
-
140
-
141
-
142
-
143
-
144
-
145
-
146
-
147
-
148
-
149
-
150
-
151
-
152
-
153
-
154
-
155
-
156
-
157
-
158
-
159
-
160
-
161
-
162
-
163
-
164
-
165
-
166
-
167
-
168
-
169
-
170
-
171
-
172
-
173
-
174
-
175
-
176
-
177
-
178
-
179
-
180
-
181
-
182
-
183
-
184
-
185
-
186
-
187
-
188
-
189
-
190
-
191
-
192
-
193
-
194
-
195
-
196
 |
 |
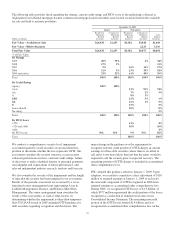
Our loan portfolio continued to be diversified among
numerous industries and types of businesses. The loans that
we hold are also concentrated in, and diversified across, our
principal geographic markets.
Commercial lending is the largest category and is the most
sensitive to changes in assumptions and judgments underlying
the determination of the allowance for loan and lease losses.
We have allocated $3.4 billion, or 66%, of the total allowance
for loan and lease losses at December 31, 2009 to these loans.
We allocated $1.7 billion, or 34%, of the remaining allowance
at that date to consumer lending. This allocation also
considers other relevant factors such as:
(a) Actual versus estimated losses,
(b) Regional and national economic conditions,
(c) Business segment and portfolio concentrations,
(d) Industry conditions,
(e) The impact of government regulations, and
(f) Risk of potential estimation or judgmental errors,
including the accuracy of risk ratings.
Higher Risk Loans
Our loan portfolio contains higher risk loans that are more
likely to result in credit losses. We established specific and
pooled reserves on the total commercial lending category,
including higher risk loans, of $3.4 billion at December 31,
2009. This represented approximately two-thirds of the total
allowance for loan and lease losses of $5.1 billion at that date.
The remaining one-third of the allowance for loan and lease
losses pertained to the total consumer lending category. This
category of loans is more homogenous in nature and has
certain characteristics that can be assessed at a total portfolio
level in terms of loans representing higher risk. We do not
consider government insured/government guaranteed loans to
be higher risk as we do not believe these loans will result in a
significant loss because of their structure. These loans are
excluded from the following assessment of higher risk loans.
Our home equity lines of credit and installment loans
outstanding totaled $35.9 billion at December 31, 2009. In this
portfolio, we consider the higher risk loans to be those with a
recent FICO credit score of less than or equal to 660 and a
loan-to-value ratio greater than 90%. Such loans totaled $1.2
billion or approximately 3% of the total home equity line and
installment loans at December 31, 2009. These higher risk
loans were concentrated in our geographic footprint with 28%
in Pennsylvania, 14% in Ohio, 11% in New Jersey, 7% in
Illinois, 6% Missouri, and 5% in Kentucky, with the
remaining loans dispersed across several other states. Option
ARM loans and negative amortization loans in this portfolio
were not significant. Within the higher risk home equity
portfolio, approximately 10% are in some stage of
delinquency and 5% are in late stage (90+ days) delinquency
status.
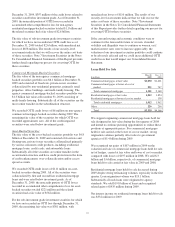
In our $18.2 billion residential mortgage portfolio, loans with
a recent FICO credit score of less than or equal to 660 and a
loan-to-value ratio greater than 90% totaled $.8 billion and
comprised approximately 5% of this portfolio at December 31,
2009. Twenty-two percent of the higher risk loans are located
in California, 13% in Florida, 10% in Illinois, 8% in
Maryland, 5% in Pennsylvania, and 5% in New Jersey, with
the remaining loans dispersed across several other states.
Option ARM loans and negative amortization loans in this
portfolio were not significant. Within the higher risk
residential mortgage portfolio of $.8 billion, approximately
53% are in some stage of delinquency and 41% are in 90+
days late stage delinquency status.
Within our home equity lines of credit, installment loans and
residential mortgage portfolios, approximately 5% of the
aggregate $54.1 billion loan outstandings at December 31,
2009 have loan-to-value ratios in excess of 100%. The impact
of housing price depreciation is reflected in the allowance for
loans and lease losses as a result of the consumer reserve
methodology process. The consumer reserve process is
sensitive to collateral values which in turn affect loan loss
severity. While our consumer reserve methodology strives to
reflect all significant risk factors, there is an element of
uncertainty associated with, but not limited to, potential
imprecision in the estimation process due to the inherent time
lag of obtaining information such as housing price
depreciation. We provide additional reserves where
appropriate to provide coverage for losses attributable to such
risks.
We obtain updated property values annually for select
residential mortgage loan portfolios. We are expanding this
valuation process to update the property values on the
majority of our real estate secured consumer loan portfolios.
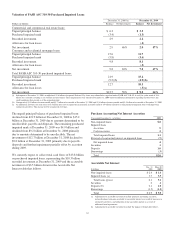
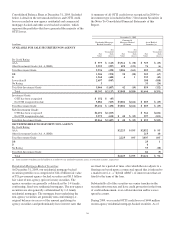
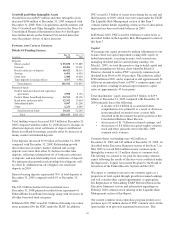
Information related to purchased impaired loans, purchase
accounting accretion and accretable net interest recognized
during 2009 in connection with our acquisition of National
City follows.
31