PNC Bank 2009 Annual Report Download - page 51
Download and view the complete annual report
Please find page 51 of the 2009 PNC Bank annual report below. You can navigate through the pages in the report by either clicking on the pages listed below, or by using the keyword search tool below to find specific information within the annual report.-
 1
1 -
2
-
3
-
4
-
5
-
6
-
7
-
8
-
9
-
10
-
11
-
12
-
13
-
14
-
15
-
16
-
17
-
18
-
19
-
20
-
21
-
22
-
23
-
24
-
25
-
26
-
27
-
28
-
29
-
30
-
31
-
32
-
33
-
34
-
35
-
36
-
37
-
38
-
39
-
40
-
 41
41 -
 42
42 -
 43
43 -
 44
44 -
 45
45 -
 46
46 -
 47
47 -
 48
48 -
 49
49 -
 50
50 -
 51
51 -
 52
52 -
 53
53 -
 54
54 -
 55
55 -
 56
56 -
 57
57 -
 58
58 -
 59
59 -
 60
60 -
 61
61 -
62
-
63
-
64
-
65
-
66
-
67
-
68
-
69
-
70
-
71
-
72
-
73
-
74
-
75
-
76
-
77
-
78
-
79
-
80
-
81
-
82
-
83
-
84
-
85
-
86
-
87
-
88
-
89
-
90
-
91
-
92
-
93
-
94
-
95
-
96
-
97
-
98
-
99
-
100
-
101
-
102
-
103
-
104
-
105
-
106
-
107
-
108
-
109
-
110
-
111
-
112
-
113
-
114
-
115
-
116
-
117
-
118
-
119
-
120
-
121
-
122
-
123
-
124
-
125
-
126
-
127
-
128
-
129
-
130
-
131
-
132
-
133
-
134
-
135
-
136
-
137
-
138
-
139
-
140
-
141
-
142
-
143
-
144
-
145
-
146
-
147
-
148
-
149
-
150
-
151
-
152
-
153
-
154
-
155
-
156
-
157
-
158
-
159
-
160
-
161
-
162
-
163
-
164
-
165
-
166
-
167
-
168
-
169
-
170
-
171
-
172
-
173
-
174
-
175
-
176
-
177
-
178
-
179
-
180
-
181
-
182
-
183
-
184
-
185
-
186
-
187
-
188
-
189
-
190
-
191
-
192
-
193
-
194
-
195
-
196
 |
 |

pricing the loans. When available, valuation assumptions
included observable inputs based on whole loan sales.
Adjustments are made to these assumptions to account for
situations when uncertainties exist, including market
conditions and liquidity. Credit risk is included as part of our
valuation process for these loans by considering expected
rates of return for market participants for similar loans in the
marketplace. Based on the significance of unobservable
inputs, we classify this portfolio as Level 3.
Equity Investments
The valuation of direct and indirect private equity investments
requires significant management judgment due to the absence
of quoted market prices, inherent lack of liquidity and the
long-term nature of such investments. The carrying values of
direct and affiliated partnership interests reflect the expected
exit price and are based on various techniques including
publicly traded price, multiples of adjusted earnings of the
entity, independent appraisals, anticipated financing and sale
transactions with third parties, or the pricing used to value the
entity in a recent financing transaction. In September 2009,
the FASB issued ASU 2009-12 – Fair Value Measurements
and Disclosures (Topic 820) – Investments in Certain Entities
that Calculate Net Asset Value per Share (or Its Equivalent).
Based on the guidance, we value indirect investments in
private equity funds based on net asset value as provided in
the financial statements that we receive from their managers.
Due to the time lag in our receipt of the financial information
and based on a review of investments and valuation
techniques applied, adjustments to the manager-provided
value are made when available recent portfolio company
information or market information indicates a significant
change in value from that provided by the manager of the
fund. These investments are classified as Level 3.
Customer Resale Agreements
We account for structured resale agreements, which are
economically hedged using free-standing financial derivatives,
at fair value. The fair value for structured resale agreements is
determined using a model which includes observable market
data such as interest rates as inputs. Readily observable
market inputs to this model can be validated to external
sources, including yield curves, implied volatility or other
market-related data. These instruments are classified as
Level 2.
BlackRock Series C Preferred Stock
Effective February 27, 2009, we elected to account for the
approximately 2.9 million shares of the BlackRock Series C
Preferred Stock received in a stock exchange with BlackRock
at fair value. The Series C Preferred Stock economically
hedges the BlackRock LTIP liability that is accounted for as a
derivative. The fair value of the Series C Preferred Stock is
determined using a third-party modeling approach, which
includes both observable and unobservable inputs. This
approach considers expectations of a default/liquidation event
and the use of liquidity discounts based on our inability to sell
the security at a fair, open market price in a timely manner.
Due to the significance of unobservable inputs, this security is
classified as Level 3.
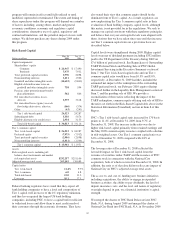
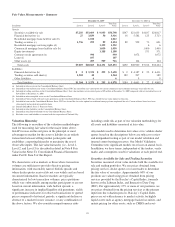
Level 3 Assets and Liabilities
Financial instruments are considered Level 3 when their
values are determined using pricing models, discounted cash
flow methodologies or similar techniques and at least one
significant model assumption or input is unobservable.
Level 3 Assets and Liabilities
Dollars in millions
Total
Level 3
Assets
Total
Level 3
Liabilities
% of Total
Assets
at Fair Value
% of Total
Liabilities
at Fair Value
%of
Consolidated
Assets
%of
Consolidated
Liabilities
December 31, 2009 $14,151 $295 22% 6% 5% < 1%
December 31, 2008 7,012 22 19% < 1% 2% < 1%
During 2009, securities transferred into Level 3 from Level 2
exceeded securities transferred out by $4.4 billion. Total
securities measured at fair value and classified in Level 3 at
December 31, 2009 and December 31, 2008 included securities
available for sale and trading securities consisting primarily of
non-agency residential mortgage-backed securities and asset-
backed securities where management determined that the
volume and level of activity for these assets had significantly
decreased. There have been no recent new “private label” issues
in the residential mortgage-backed securities market. The lack
of relevant market activity for these securities resulted in
management modifying its valuation methodology for the
instruments transferred in 2009. Other Level 3 assets include
certain commercial mortgage loans held for sale, certain equity
securities, auction rate securities, corporate debt securities,
private equity investments, residential mortgage servicing rights
and other assets.
47