PNC Bank 2009 Annual Report Download - page 36
Download and view the complete annual report
Please find page 36 of the 2009 PNC Bank annual report below. You can navigate through the pages in the report by either clicking on the pages listed below, or by using the keyword search tool below to find specific information within the annual report.-
 1
1 -
2
-
3
-
4
-
5
-
6
-
7
-
8
-
9
-
10
-
11
-
12
-
13
-
14
-
15
-
16
-
17
-
18
-
19
-
20
-
21
-
22
-
23
-
24
-
25
-
 26
26 -
 27
27 -
 28
28 -
 29
29 -
 30
30 -
 31
31 -
 32
32 -
 33
33 -
 34
34 -
 35
35 -
 36
36 -
 37
37 -
 38
38 -
 39
39 -
 40
40 -
 41
41 -
 42
42 -
 43
43 -
 44
44 -
 45
45 -
 46
46 -
47
-
48
-
49
-
50
-
51
-
52
-
53
-
54
-
55
-
56
-
57
-
58
-
59
-
60
-
61
-
62
-
63
-
64
-
65
-
66
-
67
-
68
-
69
-
70
-
71
-
72
-
73
-
74
-
75
-
76
-
77
-
78
-
79
-
80
-
81
-
82
-
83
-
84
-
85
-
86
-
87
-
88
-
89
-
90
-
91
-
92
-
93
-
94
-
95
-
96
-
97
-
98
-
99
-
100
-
101
-
102
-
103
-
104
-
105
-
106
-
107
-
108
-
109
-
110
-
111
-
112
-
113
-
114
-
115
-
116
-
117
-
118
-
119
-
120
-
121
-
122
-
123
-
124
-
125
-
126
-
127
-
128
-
129
-
130
-
131
-
132
-
133
-
134
-
135
-
136
-
137
-
138
-
139
-
140
-
141
-
142
-
143
-
144
-
145
-
146
-
147
-
148
-
149
-
150
-
151
-
152
-
153
-
154
-
155
-
156
-
157
-
158
-
159
-
160
-
161
-
162
-
163
-
164
-
165
-
166
-
167
-
168
-
169
-
170
-
171
-
172
-
173
-
174
-
175
-
176
-
177
-
178
-
179
-
180
-
181
-
182
-
183
-
184
-
185
-
186
-
187
-
188
-
189
-
190
-
191
-
192
-
193
-
194
-
195
-
196
 |
 |

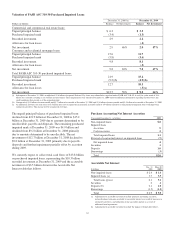
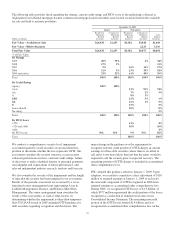
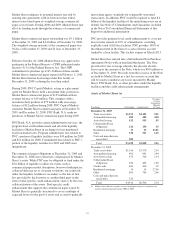
Valuation of FASB ASC 310-30 Purchased Impaired Loans
December 31, 2008 (a) December 31, 2009
Dollars in billions Balance Net Investment Balance Net Investment
Commercial and commercial real estate loans:
Unpaid principal balance $ 6.3 $ 3.5
Purchased impaired mark (3.4) (1.3)
Recorded investment 2.9 2.2
Allowance for loan losses (.2)
Net investment 2.9 46% 2.0 57%
Consumer and residential mortgage loans:
Unpaid principal balance 15.6 11.7
Purchased impaired mark (5.8) (3.6)
Recorded investment 9.8 8.1
Allowance for loan losses (.3)
Net investment 9.8 63% 7.8 67%
Total FASB ASC 310-30 purchased impaired loans:
Unpaid principal balance 21.9 15.2
Purchased impaired mark (9.2)(b) (4.9)(b)
Recorded investment 12.7 10.3
Allowance for loan losses (.5)(c)
Net investment $12.7 58% $ 9.8 64%
(a) Subsequent to December 31, 2008, an additional $2.6 billion of acquired National City loans were identified as impaired under FASB ASC 310-30. A total fair value mark of $1.8
billion was recorded, resulting in a $.8 billion net investment. These impairments were effective December 31, 2008 based on additional information regarding the borrowers and
credit conditions that existed as of the acquisition date.
(b) Comprised of $5.5 billion of nonaccretable and $3.7 billion of accretable at December 31, 2008 and $1.4 billion of nonaccretable and $3.5 billion of accretable at December 31, 2009.
(c) An additional allowance for loan losses of $.5 billion does not recognize the incremental accretable yield of $.9 billion related to certain purchased impaired loans with improving
estimated cash flows. This income will be recognized over time.
The unpaid principal balance of purchased impaired loans
declined from $21.9 billion at December 31, 2008 to $15.2
billion at December 31, 2009 due to amounts determined to be
uncollectible, payoffs and disposals. The remaining purchased
impaired mark at December 31, 2009 was $4.9 billion and
declined from $9.2 billion at December 31, 2008 primarily
due to amounts determined to be uncollectible. The net
investment of $12.7 billion at December 31, 2008 declined to
$9.8 billion at December 31, 2009 primarily due to payoffs,
disposals and further impairment partially offset by accretion
during 2009.
We currently expect to collect total cash flows of $13.8 billion
on purchased impaired loans, representing the $10.3 billion
recorded investment at December 31, 2009 and the accretable
net interest of $3.5 billion shown in the Accretable Net
Interest table that follows.
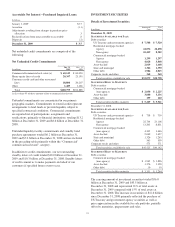
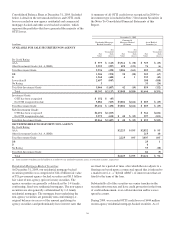
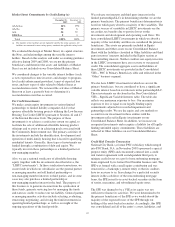
Purchase Accounting Net Interest Accretion
Year ended December 31- in billions 2009
Non-impaired loans $.8
Impaired loans
Accretion .9
Cash recoveries .2
Total impaired loans 1.1
Reversal of contractual interest on impaired loans (.7)
Net impaired loans .4
Securities .1
Deposits 1.0
Borrowings (.3)
Total $2.0
Accretable Net Interest
In billions
Dec. 31
2008
Dec. 31
2009
Non-impaired loans $ 2.4 $ 1.6
Impaired loans (a) 3.7 3.5
Total loans (gross) 6.1 5.1
Securities .2 .1
Deposits (b) 2.1 1.0
Borrowings (1.5) (1.2)
Total $ 6.9 $ 5.0
(a) Adjustments to accretable net interest include purchase accounting accretion,
reclassifications from non-accretable to accretable interest as a result of increases in
estimated cash flows, and reductions in the accretable amount as a result of
additional loan impairments.
(b) Adjustments to accretable net interest include the impact of branch divestitures.
32