PNC Bank 2009 Annual Report Download - page 82
Download and view the complete annual report
Please find page 82 of the 2009 PNC Bank annual report below. You can navigate through the pages in the report by either clicking on the pages listed below, or by using the keyword search tool below to find specific information within the annual report.-
 1
1 -
2
-
3
-
4
-
5
-
6
-
7
-
8
-
9
-
10
-
11
-
12
-
13
-
14
-
15
-
16
-
17
-
18
-
19
-
20
-
21
-
22
-
23
-
24
-
25
-
26
-
27
-
28
-
29
-
30
-
31
-
32
-
33
-
34
-
35
-
36
-
37
-
38
-
39
-
40
-
41
-
42
-
43
-
44
-
45
-
46
-
47
-
48
-
49
-
50
-
51
-
52
-
53
-
54
-
55
-
56
-
57
-
58
-
59
-
60
-
61
-
62
-
63
-
64
-
65
-
66
-
67
-
68
-
69
-
70
-
71
-
 72
72 -
 73
73 -
 74
74 -
 75
75 -
 76
76 -
 77
77 -
 78
78 -
 79
79 -
 80
80 -
 81
81 -
 82
82 -
 83
83 -
 84
84 -
 85
85 -
 86
86 -
 87
87 -
 88
88 -
 89
89 -
 90
90 -
 91
91 -
 92
92 -
93
-
94
-
95
-
96
-
97
-
98
-
99
-
100
-
101
-
102
-
103
-
104
-
105
-
106
-
107
-
108
-
109
-
110
-
111
-
112
-
113
-
114
-
115
-
116
-
117
-
118
-
119
-
120
-
121
-
122
-
123
-
124
-
125
-
126
-
127
-
128
-
129
-
130
-
131
-
132
-
133
-
134
-
135
-
136
-
137
-
138
-
139
-
140
-
141
-
142
-
143
-
144
-
145
-
146
-
147
-
148
-
149
-
150
-
151
-
152
-
153
-
154
-
155
-
156
-
157
-
158
-
159
-
160
-
161
-
162
-
163
-
164
-
165
-
166
-
167
-
168
-
169
-
170
-
171
-
172
-
173
-
174
-
175
-
176
-
177
-
178
-
179
-
180
-
181
-
182
-
183
-
184
-
185
-
186
-
187
-
188
-
189
-
190
-
191
-
192
-
193
-
194
-
195
-
196
 |
 |

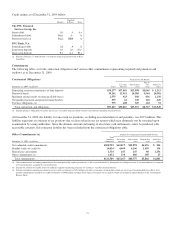
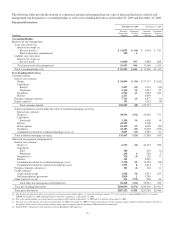
The following tables provide the notional or contractual amounts and estimated net fair value of financial derivatives used for risk
management and designated as accounting hedges as well as free-standing derivatives at December 31, 2009 and December 31, 2008.
Financial Derivatives
December 31, 2009 December 31, 2008
In millions
Notional/
Contractual
Amount
Estimated
Net Fair
Value
Notional/
Contractual
Amount
Estimated
Net Fair
Value
Accounting Hedges
Interest rate risk management
Asset rate conversion
Interest rate swaps (a)
Receive fixed (c) $ 13,055 $ (64) $ 5,618 $ 527
Forward purchase commitments 350 1
Liability rate conversion
Interest rate swaps (a)
Receive fixed 13,048 707 9,888 888
Total interest rate risk management 26,453 644 15,506 1,415
Total accounting hedges (b) $ 26,453 $ 644 $ 15,506 $1,415
Free-Standing Derivatives
Customer-related
Interest rate contracts
Swaps $ 91,090 $ (54) $ 97,337 $ (162)
Caps/floors
Sold (c) 3,457 (15) 3,976 (13)
Purchased 2,114 14 2,647 22
Swaptions 1,996 11 3,058 160
Futures 2,271 8,839
Foreign exchange contracts 7,743 16 8,877 (3)
Equity contracts 351 1,023 (4)
Total customer-related 109,022 (28) 125,757
Various instruments used to hedge the value of residential mortgage servicing
Interest rate contracts
Swaps (c) 38,596 (152) 20,930 373
Caps/floors
Purchased 5,200 50 6,500 18
Futures 41,439 4,000
Future options 18,230 23 6,000 (29)
Swaptions 24,145 (22) 12,600 (274)
Commitments related to residential mortgage assets (c) 3,857 (15) 2,950 21
Total residential mortgage servicing 131,467 (116) 52,980 109
Other risk management and proprietary
Interest rate contracts
Swaps (c) 6,615 (12) 24,432 656
Caps/floors
Sold 100 624 (1)
Purchased 250 6 740 3
Swaptions (c) 720 (9) 276 17
Futures 315 8,359
Commitments related to residential mortgage assets 5,758 20 15,659 (20)
Commitments related to commercial mortgage assets 1,733 8 2,624 7
Foreign exchange contracts (c) 301 (1) 144 11
Credit contracts
Credit default swaps 1,588 50 2,937 205
Risk participation agreements 2,819 1 3,290
Other contracts (c) (d) 211 (275) 438 44
Total other risk management and proprietary 20,410 (212) 59,523 922
Total free-standing derivatives $260,899 $(356) $238,260 $1,031
Total gross derivatives $287,352 $ 288 $253,766 $2,446
(a) The floating rate portion of interest rate contracts is based on money-market indices. As a percent of notional amount, 57% were based on 1-month LIBOR and 43% on 3-month
LIBOR at December 31, 2009 compared with 55% and 45%, respectively, at December 31, 2008.
(b) Fair value amount includes net accrued interest receivable of $162 million at December 31, 2009 and $147 million at December 31, 2008.
(c) The increases in the negative fair values from December 31, 2008 to December 31, 2009 for interest rate contracts, foreign exchange, equity contracts and other contracts were due to
the changes in fair values of the existing contracts along with new contracts entered into during 2009 and contracts terminated.
(d) Includes PNC’s obligation to fund a portion of certain BlackRock LTIP programs.
78