PNC Bank 2009 Annual Report Download - page 79
Download and view the complete annual report
Please find page 79 of the 2009 PNC Bank annual report below. You can navigate through the pages in the report by either clicking on the pages listed below, or by using the keyword search tool below to find specific information within the annual report.-
 1
1 -
2
-
3
-
4
-
5
-
6
-
7
-
8
-
9
-
10
-
11
-
12
-
13
-
14
-
15
-
16
-
17
-
18
-
19
-
20
-
21
-
22
-
23
-
24
-
25
-
26
-
27
-
28
-
29
-
30
-
31
-
32
-
33
-
34
-
35
-
36
-
37
-
38
-
39
-
40
-
41
-
42
-
43
-
44
-
45
-
46
-
47
-
48
-
49
-
50
-
51
-
52
-
53
-
54
-
55
-
56
-
57
-
58
-
59
-
60
-
61
-
62
-
63
-
64
-
65
-
66
-
67
-
68
-
 69
69 -
 70
70 -
 71
71 -
 72
72 -
 73
73 -
 74
74 -
 75
75 -
 76
76 -
 77
77 -
 78
78 -
 79
79 -
 80
80 -
 81
81 -
 82
82 -
 83
83 -
 84
84 -
 85
85 -
 86
86 -
 87
87 -
 88
88 -
 89
89 -
90
-
91
-
92
-
93
-
94
-
95
-
96
-
97
-
98
-
99
-
100
-
101
-
102
-
103
-
104
-
105
-
106
-
107
-
108
-
109
-
110
-
111
-
112
-
113
-
114
-
115
-
116
-
117
-
118
-
119
-
120
-
121
-
122
-
123
-
124
-
125
-
126
-
127
-
128
-
129
-
130
-
131
-
132
-
133
-
134
-
135
-
136
-
137
-
138
-
139
-
140
-
141
-
142
-
143
-
144
-
145
-
146
-
147
-
148
-
149
-
150
-
151
-
152
-
153
-
154
-
155
-
156
-
157
-
158
-
159
-
160
-
161
-
162
-
163
-
164
-
165
-
166
-
167
-
168
-
169
-
170
-
171
-
172
-
173
-
174
-
175
-
176
-
177
-
178
-
179
-
180
-
181
-
182
-
183
-
184
-
185
-
186
-
187
-
188
-
189
-
190
-
191
-
192
-
193
-
194
-
195
-
196
 |
 |
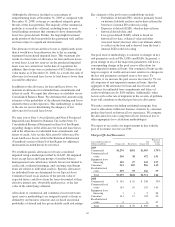
Net Interest Income Sensitivity To Alternative Rate
Scenarios (Fourth Quarter 2009)
PNC
Economist
Market
Forward
Two-Ten
Inversion
First year sensitivity .9% .6% .9%
Second year sensitivity (1.4)% (1.3)% .3%
All changes in forecasted net interest income are relative to
results in a base rate scenario where current market rates are
assumed to remain unchanged over the forecast horizon.
When forecasting net interest income, we make assumptions
about interest rates and the shape of the yield curve, the
volume and characteristics of new business, and the behavior
of existing on- and off-balance sheet positions. These
assumptions determine the future level of simulated net
interest income in the base interest rate scenario and the other
interest rate scenarios presented in the following table. These
simulations assume that as assets and liabilities mature, they
are replaced or repriced at then current market rates.
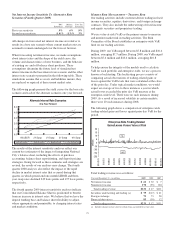
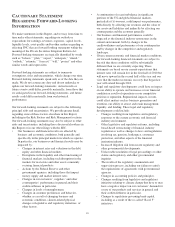
The following graph presents the yield curves for the base rate
scenario and each of the alternate scenarios one year forward.
Alternate Interest Rate Scenarios
One Year Forward
0.0
1.0
2.0
3.0
5.0
4.0
1M LIBOR 2Y Swap 3Y Swap 5Y Swap 10Y Swap
Base Rates PNC Economist Market Forward Two-Ten Inversion
The results of the interest sensitivity analyses reflect our
current best estimates of the impact of integrating National
City’s balance sheet, including the effects of purchase
accounting, balance sheet repositioning, and deposit pricing
strategies. Going forward as these estimates and strategies are
revised, the results of our analyses may change. The fourth
quarter 2008 analyses also reflect the impact of the rapid
decline in market interest rates that occurred during that
quarter, in which period-end one-month LIBOR and three-
year swap rates declined 349 basis points and 197 basis points,
respectively.
The fourth quarter 2009 interest sensitivity analyses indicate
that our Consolidated Balance Sheet is positioned to benefit
from an increase in interest rates. We believe that we have the
deposit funding base and balance sheet flexibility to adjust,
where appropriate and permissible, to changing interest rates
and market conditions.
M
ARKET
R
ISK
M
ANAGEMENT
–T
RADING
R
ISK
Our trading activities include customer-driven trading in fixed
income securities, equities, derivatives, and foreign exchange
contracts. They also include the underwriting of fixed income
and equity securities and proprietary trading.
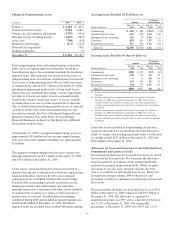
We use value-at-risk (VaR) as the primary means to measure
and monitor market risk in trading activities. The Risk
Committee of the Board establishes an enterprise-wide VaR
limit on our trading activities.
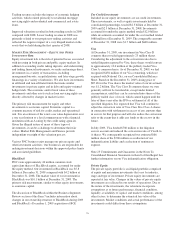
During 2009, our VaR ranged between $5.8 million and $10.4
million, averaging $7.7 million. During 2008, our VaR ranged
between $5.4 million and $18.4 million, averaging $10.8
million.
To help ensure the integrity of the models used to calculate
VaR for each portfolio and enterprise-wide, we use a process
known as backtesting. The backtesting process consists of
comparing actual observations of trading-related gains or
losses against the VaR levels that were calculated at the close
of the prior day. Under typical market conditions, we would
expect an average of two to three instances a year in which
actual losses exceeded the prior day VaR measure at the
enterprise-wide level. There were no such instances during
2009. As a result of increased volatility in certain markets,
there were 10 such instances during 2008.
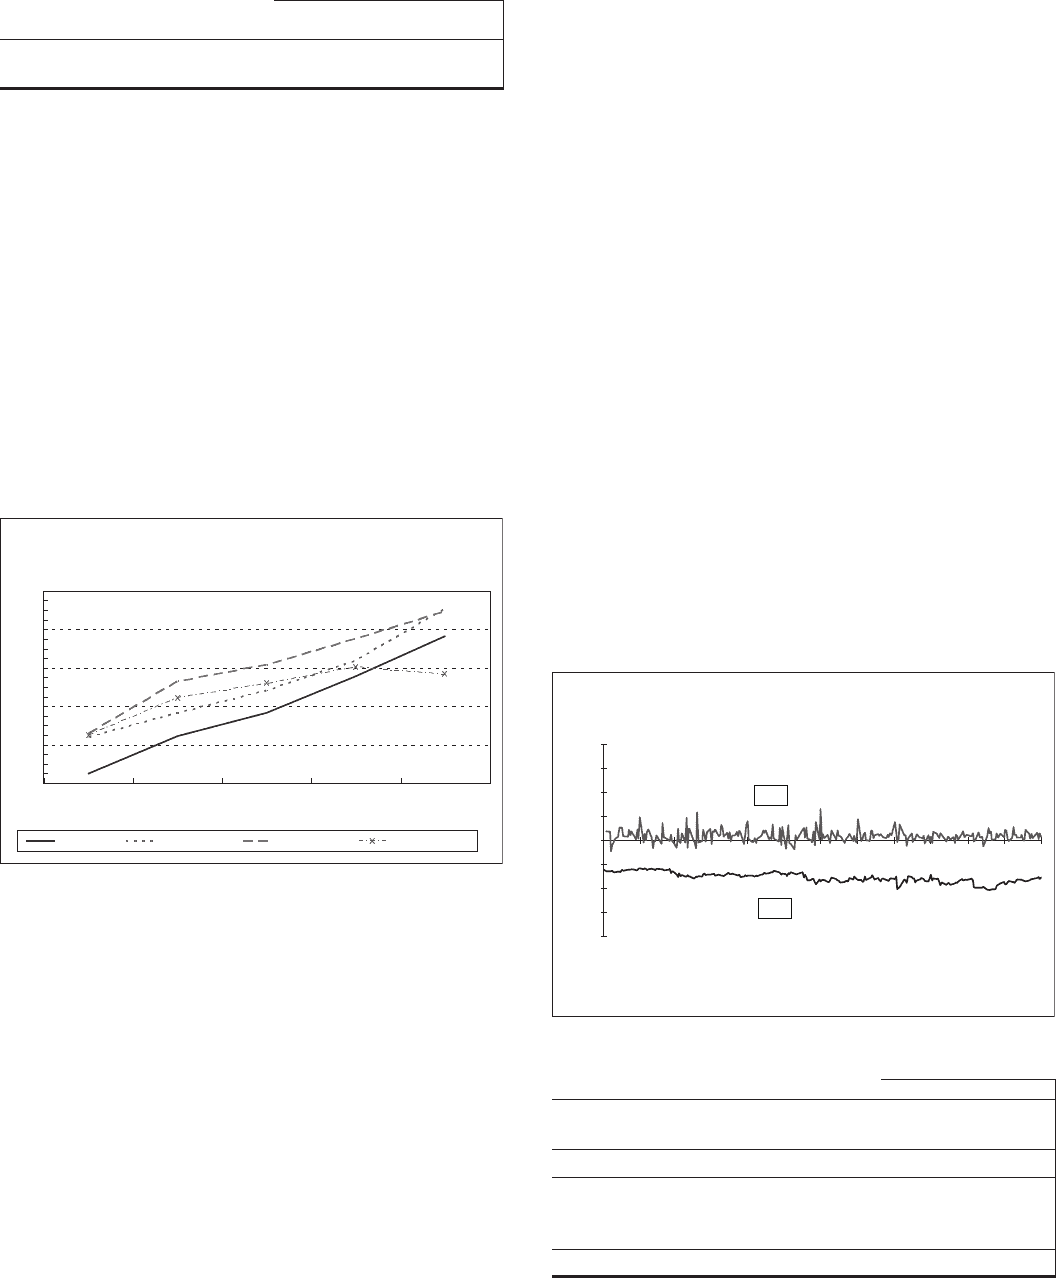
The following graph shows a comparison of enterprise-wide
trading-related gains and losses against prior day VaR for the
period.
Enterprise-Wide Trading-Related
Gains/Losses Versus Value at Risk
(20)
(15)
(10)
(5)
0
5
10
15
20
12/31/08
1/31/09
2/28/09
3/31/09
4/30/09
5/31/09
6/30/09
7/31/09
8/31/09
9/30/09
10/31/09
11/30/09
12/31/09
Millions
VaR
P&L
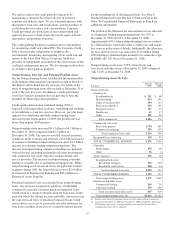
Total trading revenue was as follows:
Year end December 31 – in millions 2009 2008 2007
Net interest income $61 $72 $ 7
Noninterest income 170 (55) 104
Total trading revenue $231 $ 17 $111
Securities underwriting and trading (a) $75 $(17) $ 41
Foreign exchange 73 73 58
Financial derivatives 83 (39) 12
Total trading revenue $231 $ 17 $111
(a) Includes changes in fair value for certain loans accounted for at fair value.
75