PNC Bank 2009 Annual Report Download - page 152
Download and view the complete annual report
Please find page 152 of the 2009 PNC Bank annual report below. You can navigate through the pages in the report by either clicking on the pages listed below, or by using the keyword search tool below to find specific information within the annual report.-
 1
1 -
2
-
3
-
4
-
5
-
6
-
7
-
8
-
9
-
10
-
11
-
12
-
13
-
14
-
15
-
16
-
17
-
18
-
19
-
20
-
21
-
22
-
23
-
24
-
25
-
26
-
27
-
28
-
29
-
30
-
31
-
32
-
33
-
34
-
35
-
36
-
37
-
38
-
39
-
40
-
41
-
42
-
43
-
44
-
45
-
46
-
47
-
48
-
49
-
50
-
51
-
52
-
53
-
54
-
55
-
56
-
57
-
58
-
59
-
60
-
61
-
62
-
63
-
64
-
65
-
66
-
67
-
68
-
69
-
70
-
71
-
72
-
73
-
74
-
75
-
76
-
77
-
78
-
79
-
80
-
81
-
82
-
83
-
84
-
85
-
86
-
87
-
88
-
89
-
90
-
91
-
92
-
93
-
94
-
95
-
96
-
97
-
98
-
99
-
100
-
101
-
102
-
103
-
104
-
105
-
106
-
107
-
108
-
109
-
110
-
111
-
112
-
113
-
114
-
115
-
116
-
117
-
118
-
119
-
120
-
121
-
122
-
123
-
124
-
125
-
126
-
127
-
128
-
129
-
130
-
131
-
132
-
133
-
134
-
135
-
136
-
137
-
138
-
139
-
140
-
141
-
 142
142 -
 143
143 -
 144
144 -
 145
145 -
 146
146 -
 147
147 -
 148
148 -
 149
149 -
 150
150 -
 151
151 -
 152
152 -
 153
153 -
 154
154 -
 155
155 -
 156
156 -
 157
157 -
 158
158 -
 159
159 -
 160
160 -
 161
161 -
 162
162 -
163
-
164
-
165
-
166
-
167
-
168
-
169
-
170
-
171
-
172
-
173
-
174
-
175
-
176
-
177
-
178
-
179
-
180
-
181
-
182
-
183
-
184
-
185
-
186
-
187
-
188
-
189
-
190
-
191
-
192
-
193
-
194
-
195
-
196
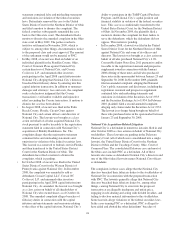
 |
 |

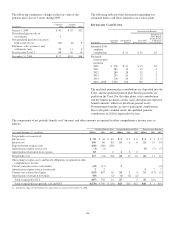
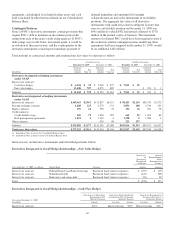
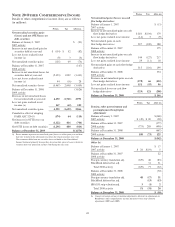
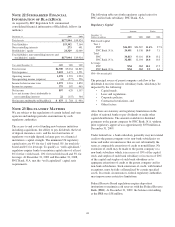
Derivatives Not Designated as Hedging Instruments
Gain (Loss) on Derivatives Recognized in Noninterest Income
In millions
Year Ended
December 31, 2009
Interest rate contracts $ 107
Foreign exchange contracts 71
Equity contracts 2
Credit contracts (59)
Other contracts (a) (178)
Total $ (57)
(a) Relates to BlackRock LTIP.
We write caps and floors for customers, risk management and
proprietary trading purposes. At December 31, 2009, the fair
value of the written caps and floors liability on our
Consolidated Balance Sheet was $15 million. Our ultimate
obligation under written options is based on future market
conditions and is only quantifiable at settlement. We manage
our market risk exposure from customer positions through
transactions with third-party dealers.
C
REDIT
D
ERIVATIVES
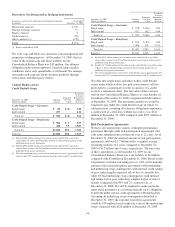
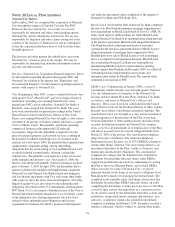
Credit Default Swaps
December 31, 2009
Dollars in millions
Notional
Amount
Estimated
Net Fair
Value
Weighted-
Average
Remaining
Maturity
In Years
Credit Default Swaps – Guarantor
Single name $ 85 $ (4) 3.18
Index traded 457 6.12
Total (a) $ 542 $ (4) 5.66
Credit Default Swaps – Beneficiary
Single name $ 586 $ 1 3.69
Index traded 460 53 35.89
Total (b) $1,046 $54 17.85
Total (c) $1,588 $50 13.69
(a) Includes $496 million notional of investment grade credit default swaps with a
rating of Baa3 or above and $46 million notional of subinvestment grade based on
published rating agency information.
(b) Includes $894 million notional of investment grade credit default swaps with a
rating of Baa3 or above and $152 million notional of subinvestment grade based on
published rating agency information.
(c) The referenced/underlying assets for these credit default swaps is approximately 66%
corporate debt, 29% commercial mortgage-backed securities and 5% related to loans.
December 31, 2008
Dollars in millions
Notional
Amount
Estimated
Net Fair
Value
Weighted-
Average
Remaining
Maturity
In Years
Credit Default Swaps – Guarantor
Single name $ 278 $ (38) 3.84
Index traded 677 (42) 4.84
Total (a) $ 955 $ (80) 4.54
Credit Default Swaps – Beneficiary
Single name $ 974 $ 84 3.82
Index traded 1,008 201 31.82
Total (b) $1,982 $285 18.06
Total (c) $2,937 $205 13.67
(a) Includes $883 million notional of investment grade credit default swaps with a
rating of Baa3 or above and $72 million notional of subinvestment grade based on
published rating agency information.
(b) Includes $1.7 billion notional of investment grade credit default swaps with a rating
of Baa3 or above and $263 million notional of subinvestment grade based on
published rating agency information.
(c) The referenced/underlying assets for these credit default swaps is approximately 70%
corporate debt, 27% commercial mortgage-backed securities and 3% related to loans.
We enter into single name and index traded credit default
swaps under which we buy loss protection from or sell loss
protection to a counterparty for the occurrence of a credit
event of a referenced entity. The fair value of the contracts
sold on our Consolidated Balance Sheet was a net liability of
$4 million at December 31, 2009 compared with $80 million
at December 31, 2008. The maximum amount we would be
required to pay under the credit default swaps in which we
sold protection, assuming all reference obligations experience
a credit event at a total loss, without recoveries, was $542
million at December 31, 2009 compared with $955 million at
December 31, 2008.
Risk Participation Agreements
We have also entered into various contingent performance
guarantees through credit risk participation agreements sold
with terms ranging from less than one year to 22 years. As of
December 31, 2009 the notional amount of risk participation
agreements sold was $1.7 billion with a weighted average
remaining maturity of 2 years compared to December 31,
2008 of $1.9 billion and 3 years, respectively. The fair value
of these agreements as of December 31, 2009 on our
Consolidated Balance Sheet was a net liability of $2 million
compared with $3 million at December 31, 2008. Based on the
Corporation’s internal risk rating process, 94% of the notional
amount of the risk participation agreements sold outstanding
had underlying swap counterparties with internal credit ratings
of pass, indicating the expected risk of loss is currently low,
while 6% had underlying swap counterparties with internal
risk ratings below pass, indicating a higher degree of risk of
default, compared with 98% and 2%, respectively, at
December 31, 2008. We will be required to make payments
under these guarantees if a customer defaults on its obligation
to perform under certain credit agreements with third parties.
Assuming all underlying swap counterparties defaulted at
December 31, 2009, the exposure from these agreements
would be $78 million based on the fair value of the underlying
swaps compared with $128 million at December 31, 2008.
148