PNC Bank 2009 Annual Report Download - page 49
Download and view the complete annual report
Please find page 49 of the 2009 PNC Bank annual report below. You can navigate through the pages in the report by either clicking on the pages listed below, or by using the keyword search tool below to find specific information within the annual report.-
 1
1 -
2
-
3
-
4
-
5
-
6
-
7
-
8
-
9
-
10
-
11
-
12
-
13
-
14
-
15
-
16
-
17
-
18
-
19
-
20
-
21
-
22
-
23
-
24
-
25
-
26
-
27
-
28
-
29
-
30
-
31
-
32
-
33
-
34
-
35
-
36
-
37
-
38
-
 39
39 -
 40
40 -
 41
41 -
 42
42 -
 43
43 -
 44
44 -
 45
45 -
 46
46 -
 47
47 -
 48
48 -
 49
49 -
 50
50 -
 51
51 -
 52
52 -
 53
53 -
 54
54 -
 55
55 -
 56
56 -
 57
57 -
 58
58 -
 59
59 -
60
-
61
-
62
-
63
-
64
-
65
-
66
-
67
-
68
-
69
-
70
-
71
-
72
-
73
-
74
-
75
-
76
-
77
-
78
-
79
-
80
-
81
-
82
-
83
-
84
-
85
-
86
-
87
-
88
-
89
-
90
-
91
-
92
-
93
-
94
-
95
-
96
-
97
-
98
-
99
-
100
-
101
-
102
-
103
-
104
-
105
-
106
-
107
-
108
-
109
-
110
-
111
-
112
-
113
-
114
-
115
-
116
-
117
-
118
-
119
-
120
-
121
-
122
-
123
-
124
-
125
-
126
-
127
-
128
-
129
-
130
-
131
-
132
-
133
-
134
-
135
-
136
-
137
-
138
-
139
-
140
-
141
-
142
-
143
-
144
-
145
-
146
-
147
-
148
-
149
-
150
-
151
-
152
-
153
-
154
-
155
-
156
-
157
-
158
-
159
-
160
-
161
-
162
-
163
-
164
-
165
-
166
-
167
-
168
-
169
-
170
-
171
-
172
-
173
-
174
-
175
-
176
-
177
-
178
-
179
-
180
-
181
-
182
-
183
-
184
-
185
-
186
-
187
-
188
-
189
-
190
-
191
-
192
-
193
-
194
-
195
-
196
 |
 |

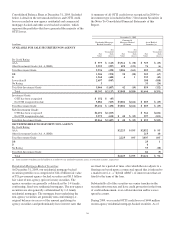
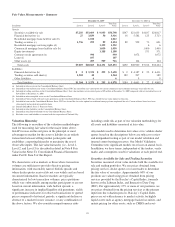
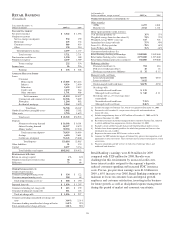
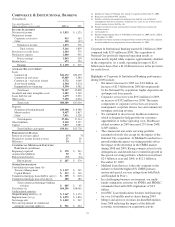
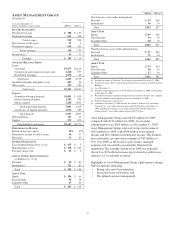
Fair Value Measurements – Summary
December 31, 2009 December 31, 2008 (j)
In millions Level 1 Level 2 Level 3
Total Fair
Value Level 1 Level 2 Level 3
Total Fair
Value
Assets
Securities available for sale $7,256 $33,609 $ 9,933 $50,798 $347 $21,633 $4,837 $26,817
Financial derivatives (a) 27 3,839 50 3,916 16 5,582 125 5,723
Residential mortgage loans held for sale (b) 1,012 1,012
Trading securities (c) 1,736 299 89 2,124 89 529 73 691
Residential mortgage servicing rights (d) 1,332 1,332 66
Commercial mortgage loans held for sale (b) 1,050 1,050 1,400 1,400
Equity investments 1,188 1,188 571 571
Customer resale agreements (e) 990 990 1,072 1,072
Loans (f) 107 107
Other assets (g) 207 509 716 144 144
Total assets $9,019 $40,063 $14,151 $63,233 $452 $28,960 $7,012 $36,424
Liabilities
Financial derivatives (h) $ 2 $ 3,331 $ 295 $ 3,628 $ 2 $ 4,387 $ 22 $ 4,411
Trading securities sold short (i) 1,302 42 1,344 182 207 389
Other liabilities 6699
Total liabilities $1,304 $ 3,379 $ 295 $ 4,978 $184 $ 4,603 $ 22 $ 4,809
(a) Included in other assets on the Consolidated Balance Sheet.
(b) Included in loans held for sale on the Consolidated Balance Sheet. PNC has elected the fair value option for certain commercial and residential mortgage loans held for sale.
(c) Included in trading securities on the Consolidated Balance Sheet. Fair value includes net unrealized gains of $9 million at December 31, 2009 compared with net unrealized losses of
$28 million at December 31, 2008.
(d) Included in other intangible assets on the Consolidated Balance Sheet.
(e) Included in Federal funds sold and resale agreements on the Consolidated Balance Sheet. PNC has elected the fair value option for this item.
(f) Included in loans on the Consolidated Balance Sheet. PNC has elected the fair value option for residential mortgage loans originated for sale. Certain of these loans have been
subsequently reclassified into portfolio loans.
(g) Includes BlackRock Series C Preferred Stock.
(h) Included in other liabilities on the Consolidated Balance Sheet.
(i) Included in other borrowed funds on the Consolidated Balance Sheet.
(j) Excludes assets and liabilities associated with the acquisition of National City.
Valuation Hierarchy
The following is an outline of the valuation methodologies
used for measuring fair value for the major items above.
GAAP focuses on the exit price in the principal or most
advantageous market for the asset or liability in an orderly
transaction between willing market participants and
establishes a reporting hierarchy to maximize the use of
observable inputs. The fair value hierarchy (i.e., Level 1,
Level 2, and Level 3) is described in detail in Note 8 Fair
Value in the Notes To Consolidated Financial Statements
under Part II, Item 8 of this Report.
We characterize active markets as those where transaction
volumes are sufficient to provide objective pricing
information, with reasonably narrow bid/ask spreads and
where dealer quotes received do not vary widely and are based
on current information. Inactive markets are typically
characterized by low transaction volumes, price quotations
which vary substantially among market participants or are not
based on current information, wide bid/ask spreads, a
significant increase in implied liquidity risk premiums, yields,
or performance indicators for observed transactions or quoted
prices compared to historical periods, a significant decline or
absence of a market for new issuance, or any combination of
the above factors. We also consider nonperformance risks
including credit risk as part of our valuation methodology for
all assets and liabilities measured at fair value.
Any models used to determine fair values or to validate dealer
quotes based on the descriptions below are subject to review
and independent testing as part of our model validation and
internal control testing processes. Our Model Validation
Committee tests significant models on at least an annual basis.
In addition, we have teams, independent of the traders, verify
marks and assumptions used for valuations at each period end.
Securities Available for Sale and Trading Securities
Securities measured at fair value include both the available for
sale and trading portfolios. We use prices obtained from
pricing services, dealer quotes or recent trades to determine
the fair value of securities. Approximately 60% of our
positions are valued using prices obtained from pricing
services provided by the Barclay’s Capital Index, formerly
known as the Lehman Index, and Interactive Data Corp.
(IDC). For approximately 15% or more of our positions, we
use prices obtained from the pricing services as the primary
input into the valuation process. Barclay’s Capital Index
prices are set with reference to market activity for highly
liquid assets such as agency mortgage-backed securities, and
matrix pricing for other assets, such as CMBS and asset-
45