PNC Bank 2009 Annual Report Download - page 59
Download and view the complete annual report
Please find page 59 of the 2009 PNC Bank annual report below. You can navigate through the pages in the report by either clicking on the pages listed below, or by using the keyword search tool below to find specific information within the annual report.-
 1
1 -
2
-
3
-
4
-
5
-
6
-
7
-
8
-
9
-
10
-
11
-
12
-
13
-
14
-
15
-
16
-
17
-
18
-
19
-
20
-
21
-
22
-
23
-
24
-
25
-
26
-
27
-
28
-
29
-
30
-
31
-
32
-
33
-
34
-
35
-
36
-
37
-
38
-
39
-
40
-
41
-
42
-
43
-
44
-
45
-
46
-
47
-
48
-
 49
49 -
 50
50 -
 51
51 -
 52
52 -
 53
53 -
 54
54 -
 55
55 -
 56
56 -
 57
57 -
 58
58 -
 59
59 -
 60
60 -
 61
61 -
 62
62 -
 63
63 -
 64
64 -
 65
65 -
 66
66 -
 67
67 -
 68
68 -
 69
69 -
70
-
71
-
72
-
73
-
74
-
75
-
76
-
77
-
78
-
79
-
80
-
81
-
82
-
83
-
84
-
85
-
86
-
87
-
88
-
89
-
90
-
91
-
92
-
93
-
94
-
95
-
96
-
97
-
98
-
99
-
100
-
101
-
102
-
103
-
104
-
105
-
106
-
107
-
108
-
109
-
110
-
111
-
112
-
113
-
114
-
115
-
116
-
117
-
118
-
119
-
120
-
121
-
122
-
123
-
124
-
125
-
126
-
127
-
128
-
129
-
130
-
131
-
132
-
133
-
134
-
135
-
136
-
137
-
138
-
139
-
140
-
141
-
142
-
143
-
144
-
145
-
146
-
147
-
148
-
149
-
150
-
151
-
152
-
153
-
154
-
155
-
156
-
157
-
158
-
159
-
160
-
161
-
162
-
163
-
164
-
165
-
166
-
167
-
168
-
169
-
170
-
171
-
172
-
173
-
174
-
175
-
176
-
177
-
178
-
179
-
180
-
181
-
182
-
183
-
184
-
185
-
186
-
187
-
188
-
189
-
190
-
191
-
192
-
193
-
194
-
195
-
196
 |
 |

A
SSET
M
ANAGEMENT
G
ROUP
(Unaudited)
Year ended December 31
Dollars in millions except as noted 2009 (a) 2008 (b)
I
NCOME
S
TATEMENT
Net interest income $ 308 $ 130
Noninterest income 611 429
Total revenue 919 559
Provision for credit losses 97 6
Noninterest expense 654 363
Pretax earnings 168 190
Income taxes 63 71
Earnings $ 105 $ 119
A
VERAGE
B
ALANCE
S
HEET
Loans
Consumer $3,957 $2,136
Commercial and commercial real estate 1,648 577
Residential mortgage 1,078 66
Total loans 6,683 2,779
Goodwill and other intangible assets 407 39
Other assets 251 183
Total assets $7,341 $3,001
Deposits
Noninterest-bearing demand $1,091 $ 859
Interest-bearing demand 1,582 700
Money market 3,208 1,855
Total transaction deposits 5,881 3,414
Certificates of deposit and other 1,076 589
Total deposits 6,957 4,003
Other liabilities 111 12
Capital 575 255
Total liabilities and equity $7,643 $4,270
P
ERFORMANCE
R
ATIOS
Return on average capital 18% 47%
Noninterest income to total revenue 66 77
Efficiency 71 65
O
THER
I
NFORMATION
Total nonperforming assets (c) (d) $ 155 $5
Impaired loans (c) (e) $ 198 $ 225
Total net charge-offs $63$2
A
SSETS
U
NDER
A
DMINISTRATION
(in billions) (c) (f) (g)
Personal $94$61
Institutional 111 83
Total $ 205 $ 144
A
SSET
T
YPE
Equity $ 100 $60
Fixed Income 58 38
Liquidity/Other 47 46
Total $ 205 $ 144
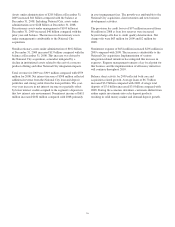
2009 (a) 2008 (b)
Discretionary assets under management
Personal $67 $38
Institutional 36 19
Total $103 $57
A
SSET
T
YPE
Equity $49 $26
Fixed Income 34 19
Liquidity/Other 20 12
Total $103 $57
Nondiscretionary assets under administration
Personal $27 $23
Institutional 75 64
Total $102 $87
A
SSET
T
YPE
Equity $51 $34
Fixed Income 24 19
Liquidity/Other 27 34
Total $102 $87
(a) Includes the impact of National City, which we acquired on December 31, 2008.
(b) Includes the legacy PNC wealth management business previously included in Retail
Banking.
(c) As of December 31.
(d) Includes nonperforming loans of $149 million at December 31, 2009 and $5 million
at December 31, 2008.
(e) Recorded investment of purchased impaired loans related to National City, adjusted
to reflect additional loan impairments effective December 31, 2008.
(f) Excludes brokerage account assets.
(g) Amounts at December 31, 2008 exclude the impact of National City. Including
National City, assets under administration totaled $228 billion at December 31,
2008, including discretionary assets under management of $103 billion and
nondiscretionary assets under administration of $125 billion.
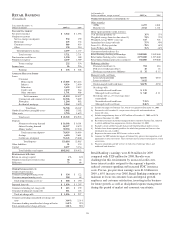
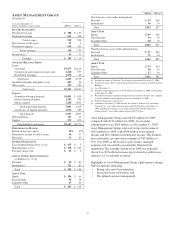
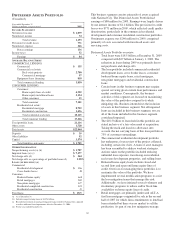
Asset Management Group earned $105 million for 2009
compared with $119 million for 2008. Assets under
administration were $205 billion as of December 31, 2009.
Asset Management Group achieved strong total revenue of
$919 million for 2009, with $308 million in net interest
income and $611 million in noninterest income. The business
increased pretax, pre-provision earnings by $69 million or
35% over 2008, as the business grew clients, managed
expenses and successfully executed the National City
integration. The earnings decline from 2008 was primarily
driven by a $91 million increase in provision for credit losses
reflective of a weakened economy.
Highlights of Asset Management Group’s performance during
2009 include the following:
• Strong sales and client retention,
• Increased client satisfaction, and
• Disciplined expense management.
55