PNC Bank 2009 Annual Report Download - page 118
Download and view the complete annual report
Please find page 118 of the 2009 PNC Bank annual report below. You can navigate through the pages in the report by either clicking on the pages listed below, or by using the keyword search tool below to find specific information within the annual report.-
 1
1 -
2
-
3
-
4
-
5
-
6
-
7
-
8
-
9
-
10
-
11
-
12
-
13
-
14
-
15
-
16
-
17
-
18
-
19
-
20
-
21
-
22
-
23
-
24
-
25
-
26
-
27
-
28
-
29
-
30
-
31
-
32
-
33
-
34
-
35
-
36
-
37
-
38
-
39
-
40
-
41
-
42
-
43
-
44
-
45
-
46
-
47
-
48
-
49
-
50
-
51
-
52
-
53
-
54
-
55
-
56
-
57
-
58
-
59
-
60
-
61
-
62
-
63
-
64
-
65
-
66
-
67
-
68
-
69
-
70
-
71
-
72
-
73
-
74
-
75
-
76
-
77
-
78
-
79
-
80
-
81
-
82
-
83
-
84
-
85
-
86
-
87
-
88
-
89
-
90
-
91
-
92
-
93
-
94
-
95
-
96
-
97
-
98
-
99
-
100
-
101
-
102
-
103
-
104
-
105
-
106
-
107
-
 108
108 -
 109
109 -
 110
110 -
 111
111 -
 112
112 -
 113
113 -
 114
114 -
 115
115 -
 116
116 -
 117
117 -
 118
118 -
 119
119 -
 120
120 -
 121
121 -
 122
122 -
 123
123 -
 124
124 -
 125
125 -
 126
126 -
 127
127 -
 128
128 -
129
-
130
-
131
-
132
-
133
-
134
-
135
-
136
-
137
-
138
-
139
-
140
-
141
-
142
-
143
-
144
-
145
-
146
-
147
-
148
-
149
-
150
-
151
-
152
-
153
-
154
-
155
-
156
-
157
-
158
-
159
-
160
-
161
-
162
-
163
-
164
-
165
-
166
-
167
-
168
-
169
-
170
-
171
-
172
-
173
-
174
-
175
-
176
-
177
-
178
-
179
-
180
-
181
-
182
-
183
-
184
-
185
-
186
-
187
-
188
-
189
-
190
-
191
-
192
-
193
-
194
-
195
-
196
 |
 |

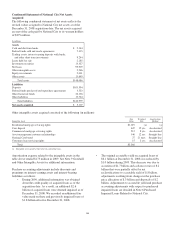
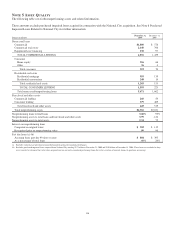
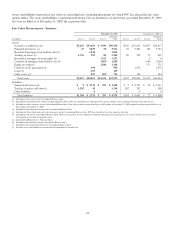
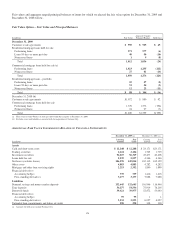
The fair value of investment securities is impacted by interest rates, credit spreads, market volatility and liquidity conditions. Net
unrealized gains and losses in the securities available for sale portfolio are included in shareholders’ equity as accumulated other
comprehensive income or loss, net of tax, unless credit-related.
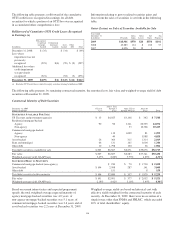
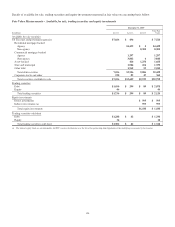
The following table presents gross unrealized loss and fair value of debt securities available for sale at December 31, 2009 and
December 31, 2008. The securities are segregated between investments that have been in a continuous unrealized loss position for
less than twelve months and twelve months or more based on the point in time the fair value declined below the amortized cost
basis. The table includes debt securities where a portion of OTTI has been recognized in accumulated other comprehensive loss.
The gross unrealized loss on debt securities held to maturity was $13 million at December 31, 2009 with the majority of positions
in a continuous loss position for less than 12 months.
Unrealized loss
position less than
12 months
Unrealized loss
position 12 months
or more Total
In millions
Unrealized
Loss
Fair
Value
Unrealized
Loss
Fair
Value
Unrealized
Loss
Fair
Value
December 31, 2009
Securities available for sale
Debt securities
US Treasury and government agencies $ (48) $ 4,015 $ (48) $ 4,015
Residential mortgage-backed
Agency (76) 6,960 $ (1) $ 56 (77) 7,016
Non-agency (7) 79 (2,346) 7,223 (2,353) 7,302
Commercial mortgage-backed
Agency (12) 779 (12) 779
Non-agency (3) 380 (219) 1,353 (222) 1,733
Asset-backed (1) 142 (380) 1,153 (381) 1,295
State and municipal (1) 49 (53) 285 (54) 334
Other debt (3) 299 (4) 18 (7) 317
Total $ (151) $12,703 $(3,003) $10,088 $(3,154) $22,791
December 31, 2008
Securities available for sale
Debt securities
Residential mortgage-backed
Agency $ (1) $ 49 $ (8) $ 188 $ (9) $ 237
Non-agency (1,774) 3,570 (2,600) 3,683 (4,374) 7,253
Commercial mortgage-backed (non-agency) (482) 2,207 (377) 1,184 (859) 3,391
Asset-backed (102) 523 (344) 887 (446) 1,410
State and municipal (56) 370 (20) 26 (76) 396
Other debt (11) 185 (4) 8 (15) 193
Total $(2,426) $ 6,904 $(3,353) $ 5,976 $(5,779) $12,880
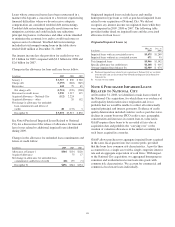
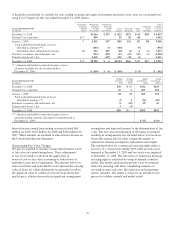
Evaluating Investments for Other-than-Temporary
Impairments
For the securities in the above table, we do not intend to sell
and have determined it is not more likely than not we will be
required to sell the security prior to recovery of the amortized
cost basis.
On at least a quarterly basis, we conduct a comprehensive
security-level assessment on all securities in an unrealized loss
position to determine if OTTI exists. An unrealized loss exists
when the current fair value of an individual security is less
than its amortized cost basis. Under the current OTTI
accounting model for debt securities, which was amended by
the FASB and adopted by PNC effective January 1, 2009, an
OTTI loss must be recognized for a debt security in an
unrealized loss position if we intend to sell the security or it is
more likely than not we will be required to sell the security
prior to recovery of its amortized cost basis. In this situation,
the amount of loss recognized in income is equal to the
difference between the fair value and the amortized cost basis
of the security. Even if we do not expect to sell the security,
we must evaluate the expected cash flows to be received to
determine if we believe a credit loss has occurred. In the event
of a credit loss, only the amount of impairment associated
with the credit loss is recognized in income. The portion of the
unrealized loss relating to other factors, such as liquidity
conditions in the market or changes in market interest rates, is
recorded in accumulated other comprehensive loss.
Equity securities are also evaluated to determine whether
the unrealized loss is expected to be recoverable based on
whether evidence exists to support a realizable value equal to
or greater than the amortized cost basis. If it is probable that
we will not recover the amortized cost basis, taking into
114