PNC Bank 2009 Annual Report Download - page 129
Download and view the complete annual report
Please find page 129 of the 2009 PNC Bank annual report below. You can navigate through the pages in the report by either clicking on the pages listed below, or by using the keyword search tool below to find specific information within the annual report.-
 1
1 -
2
-
3
-
4
-
5
-
6
-
7
-
8
-
9
-
10
-
11
-
12
-
13
-
14
-
15
-
16
-
17
-
18
-
19
-
20
-
21
-
22
-
23
-
24
-
25
-
26
-
27
-
28
-
29
-
30
-
31
-
32
-
33
-
34
-
35
-
36
-
37
-
38
-
39
-
40
-
41
-
42
-
43
-
44
-
45
-
46
-
47
-
48
-
49
-
50
-
51
-
52
-
53
-
54
-
55
-
56
-
57
-
58
-
59
-
60
-
61
-
62
-
63
-
64
-
65
-
66
-
67
-
68
-
69
-
70
-
71
-
72
-
73
-
74
-
75
-
76
-
77
-
78
-
79
-
80
-
81
-
82
-
83
-
84
-
85
-
86
-
87
-
88
-
89
-
90
-
91
-
92
-
93
-
94
-
95
-
96
-
97
-
98
-
99
-
100
-
101
-
102
-
103
-
104
-
105
-
106
-
107
-
108
-
109
-
110
-
111
-
112
-
113
-
114
-
115
-
116
-
117
-
118
-
 119
119 -
 120
120 -
 121
121 -
 122
122 -
 123
123 -
 124
124 -
 125
125 -
 126
126 -
 127
127 -
 128
128 -
 129
129 -
 130
130 -
 131
131 -
 132
132 -
 133
133 -
 134
134 -
 135
135 -
 136
136 -
 137
137 -
 138
138 -
 139
139 -
140
-
141
-
142
-
143
-
144
-
145
-
146
-
147
-
148
-
149
-
150
-
151
-
152
-
153
-
154
-
155
-
156
-
157
-
158
-
159
-
160
-
161
-
162
-
163
-
164
-
165
-
166
-
167
-
168
-
169
-
170
-
171
-
172
-
173
-
174
-
175
-
176
-
177
-
178
-
179
-
180
-
181
-
182
-
183
-
184
-
185
-
186
-
187
-
188
-
189
-
190
-
191
-
192
-
193
-
194
-
195
-
196
 |
 |
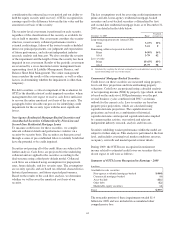
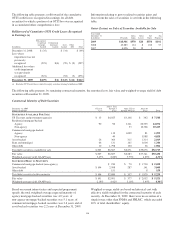
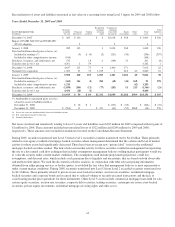
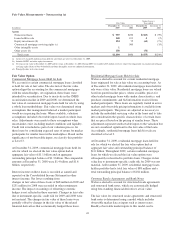
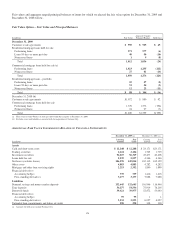
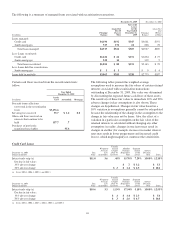
The aggregate fair values in the table above do not represent
the underlying market value of PNC as the table excludes the
following:
• real and personal property,
• lease financing,
• loan customer relationships,
• deposit customer intangibles,
• retail branch networks,
• fee-based businesses, such as asset management and
brokerage, and
• trademarks and brand names.
For net loans (excluding leases), the change in fair value as a
percentage of book value at December 31, 2009 compared
with 2008 was primarily driven by an incremental allowance
that was recorded in 2009 which reduced carrying amounts, as
well as a decrease in swap rates that are utilized in discounting
cash flows which increased fair values.
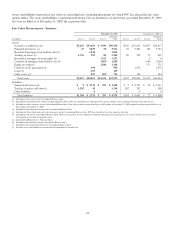
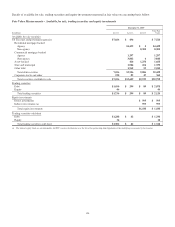
We used the following methods and assumptions to estimate
fair value amounts for financial instruments.
G
ENERAL
For short-term financial instruments realizable in three months
or less, the carrying amount reported on our Consolidated
Balance Sheet approximates fair value. Unless otherwise
stated, the rates used in discounted cash flow analyses are
based on market yield curves.
C
ASH
A
ND
S
HORT
-T
ERM
A
SSETS
The carrying amounts reported on the Consolidated Balance
Sheet for cash and short-term investments approximate fair
values primarily due to their short-term nature. For purposes
of this disclosure only, short-term assets include the
following:
• due from banks,
• interest-earning deposits with banks,
• federal funds sold and resale agreements,
• cash collateral (excluding cash collateral netted
against derivative fair values),
• customers’ acceptance liability, and
• accrued interest receivable.
S
ECURITIES
Securities include both the investment securities and trading
portfolios. We use prices obtained from pricing services,
dealer quotes or recent trades to determine the fair value of
securities. Approximately 60% of our positions are valued
using prices obtained from pricing services provided by the
Barclay’s Capital Index, formerly known as the Lehman
Index, and Interactive Data Corp. (IDC). For approximately
15% or more of our positions, we use prices obtained from the
pricing services as the primary input into the valuation
process. Barclay’s Capital Index prices are set with reference
to market activity for highly liquid assets such as agency
mortgage-backed securities, and matrix pricing for other
assets, such as CMBS and asset-backed securities. IDC
primarily uses pricing models considering adjustments for
ratings, spreads, matrix pricing and prepayments for the
instruments we value using this service, such as non-agency
residential mortgage-backed securities, agency adjustable rate
mortgage securities, agency CMOs and municipal bonds.
Dealer quotes received are typically non-binding and
corroborated with other dealers’ quotes, by reviewing
valuations of comparable instruments, or by comparison to
internal valuations.
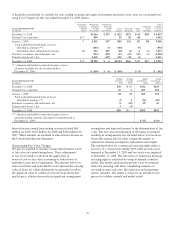
N
ET
L
OANS
A
ND
L
OANS
H
ELD
F
OR
S
ALE
Fair values are estimated based on the discounted value of
expected net cash flows incorporating assumptions about
prepayment rates, net credit losses and servicing fees. For
revolving home equity loans and commercial credit lines, this
fair value does not include any amount for new loans or the
related fees that will be generated from the existing customer
relationships. Nonaccrual loans are valued at their estimated
recovery value. Also refer to the Fair Value Option section of
this Note 8 regarding the fair value of commercial and
residential mortgage loans held for sale. Loans are presented
net of the allowance for loan and lease losses and do not
include future accretable discounts related to purchased loans.
O
THER
A
SSETS
Other assets as shown in the accompanying table include the
following:
• noncertificated interest-only strips,
• FHLB and FRB stock,
• equity investments carried at cost and fair value, and
• private equity investments carried at fair value.
Investments accounted for under the equity method, including
our investment in BlackRock, are not included in the
accompanying table.
The carrying amounts of private equity investments are
recorded at fair value. The valuation procedures applied to
direct investments include techniques such as multiples of
adjusted earnings of the entity, independent appraisals,
anticipated financing and sales transactions with third parties,
or the pricing used to value the entity in a recent financing
transaction. In September 2009, the FASB issued ASU 2009-
12 – Fair Value Measurements and Disclosures (Topic 820) –
Investments in Certain Entities That Calculate Net Asset
Value per Share (or Its Equivalent). Based on the guidance,
we value indirect investments in private equity funds based on
net asset value as provided in the financial statements that we
receive from their managers. Due to the time lag in our receipt
of the financial information and based on a review of
investments and valuation techniques applied, adjustments to
the manager-provided value are made when available recent
investment portfolio company or market information indicates
a significant change in value from that provided by the general
partner.
125