PNC Bank 2009 Annual Report Download - page 151
Download and view the complete annual report
Please find page 151 of the 2009 PNC Bank annual report below. You can navigate through the pages in the report by either clicking on the pages listed below, or by using the keyword search tool below to find specific information within the annual report.-
 1
1 -
2
-
3
-
4
-
5
-
6
-
7
-
8
-
9
-
10
-
11
-
12
-
13
-
14
-
15
-
16
-
17
-
18
-
19
-
20
-
21
-
22
-
23
-
24
-
25
-
26
-
27
-
28
-
29
-
30
-
31
-
32
-
33
-
34
-
35
-
36
-
37
-
38
-
39
-
40
-
41
-
42
-
43
-
44
-
45
-
46
-
47
-
48
-
49
-
50
-
51
-
52
-
53
-
54
-
55
-
56
-
57
-
58
-
59
-
60
-
61
-
62
-
63
-
64
-
65
-
66
-
67
-
68
-
69
-
70
-
71
-
72
-
73
-
74
-
75
-
76
-
77
-
78
-
79
-
80
-
81
-
82
-
83
-
84
-
85
-
86
-
87
-
88
-
89
-
90
-
91
-
92
-
93
-
94
-
95
-
96
-
97
-
98
-
99
-
100
-
101
-
102
-
103
-
104
-
105
-
106
-
107
-
108
-
109
-
110
-
111
-
112
-
113
-
114
-
115
-
116
-
117
-
118
-
119
-
120
-
121
-
122
-
123
-
124
-
125
-
126
-
127
-
128
-
129
-
130
-
131
-
132
-
133
-
134
-
135
-
136
-
137
-
138
-
139
-
140
-
 141
141 -
 142
142 -
 143
143 -
 144
144 -
 145
145 -
 146
146 -
 147
147 -
 148
148 -
 149
149 -
 150
150 -
 151
151 -
 152
152 -
 153
153 -
 154
154 -
 155
155 -
 156
156 -
 157
157 -
 158
158 -
 159
159 -
 160
160 -
 161
161 -
162
-
163
-
164
-
165
-
166
-
167
-
168
-
169
-
170
-
171
-
172
-
173
-
174
-
175
-
176
-
177
-
178
-
179
-
180
-
181
-
182
-
183
-
184
-
185
-
186
-
187
-
188
-
189
-
190
-
191
-
192
-
193
-
194
-
195
-
196
 |
 |

agreement, cash pledged is included in other assets and cash
held is included in other borrowed funds on our Consolidated
Balance Sheet.
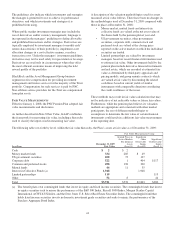
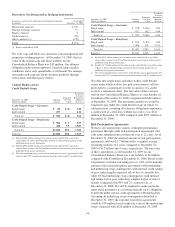
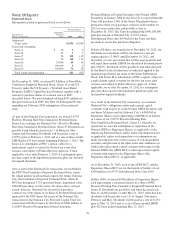
Contingent Features
Some of PNC’s derivative instruments contain provisions that
require PNC’s debt to maintain an investment grade credit
rating from each of the major credit rating agencies. If PNC’s
debt ratings were to fall below investment grade, it would be
in violation of these provisions, and the counterparties to the
derivative instruments could request immediate payment or
demand immediate and ongoing full overnight
collateralization on derivative instruments in net liability
positions. The aggregate fair value of all derivative
instruments with credit-risk-related contingent features that
were in a net liability position on December 31, 2009 was
$941 million for which PNC had posted collateral of $776
million in the normal course of business. The maximum
amount of collateral PNC would have been required to post if
the credit-risk-related contingent features underlying these
agreements had been triggered on December 31, 2009, would
be an additional $165 million.
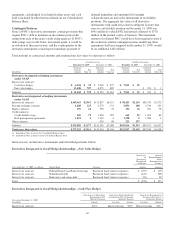
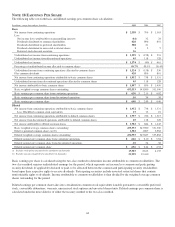
Total notional or contractual amounts and estimated net fair values for derivatives follow:
Asset Derivatives Liability Derivatives
December 31, 2009 December 31, 2008 December 31, 2009 December 31, 2008
In millions
Notional/
Contract
Amount
Fair
Value (a)
Notional/
Contract
Amount
Fair
Value (a)
Notional/
Contract
Amount
Fair
Value (b)
Notional/
Contract
Amount
Fair
Value (b)
Derivatives designated as hedging instruments
under GAAP
Interest rate contracts:
Cash flow hedges $ 6,394 $ 32 $ 5,618 $ 527 $ 7,011 $ 95
Fair value hedges 13,048 707 8,975 889 $ 913 $ 1
Subtotal $ 19,442 $ 739 $ 14,593 $1,416 $ 7,011 $ 95 $ 913 $ 1
Derivatives not designated as hedging instruments
under GAAP
Interest rate contracts $149,463 $2,963 $132,827 $6,351 $ 98,423 $3,110 $88,724 $5,573
Foreign exchange contracts 4,208 123 4,272 331 3,836 108 4,749 323
Equity contracts 195 16 520 72 156 16 503 76
Credit contracts:
Credit default swaps 926 72 1,936 287 662 22 1,001 82
Risk participation agreements 1,091 3 1,350 3 1,728 2 1,940 3
Other contracts 438 44 211 275
Subtotal $155,883 $3,177 $141,343 $7,088 $105,016 $3,533 $96,917 $6,057
Total gross derivatives $175,325 $3,916 $155,936 $8,504 $112,027 $3,628 $97,830 $6,058
(a) Included in Other Assets on the Consolidated Balance Sheet.
(b) Included in Other Liabilities on the Consolidated Balance Sheet.
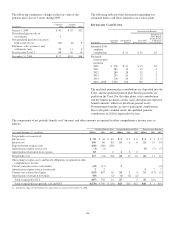
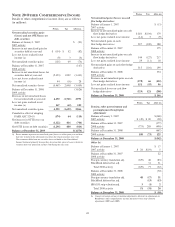
Gains (losses) on derivative instruments and related hedged items follow:
Derivatives Designated in GAAP Hedge Relationships – Fair Value Hedges
Gain (Loss)
on
Derivatives
Recognized
in Income
Gain on
Related Hedged
Items
Recognized in
Income
Year ended Dec. 31, 2009 - in millions Hedged Items Location Amount Amount
Interest rate contracts Federal Home Loan Bank borrowings Borrowed funds (interest expense) $ (107) $ 109
Interest rate contracts Subordinated debt Borrowed funds (interest expense) (447) 398
Interest rate contracts Bank notes and senior debt Borrowed funds (interest expense) (24) 28
Total $ (578) $ 535
Derivatives Designated in GAAP Hedge Relationships – Cash Flow Hedges
Year ended December 31, 2009
In millions
Gain (Loss) on Derivatives
Recognized in OCI
(Effective Portion)
Gain (Loss) Reclassified from
Accumulated OCI into Income
(Effective Portion)
Gain (Loss) Recognized in
Income on Derivatives,
Ineffective Portion
Amount Location Amount Location Amount
Interest rate contracts $(12) Interest income $319 Interest income $(2)
147