PNC Bank 2009 Annual Report Download - page 120
Download and view the complete annual report
Please find page 120 of the 2009 PNC Bank annual report below. You can navigate through the pages in the report by either clicking on the pages listed below, or by using the keyword search tool below to find specific information within the annual report.-
 1
1 -
2
-
3
-
4
-
5
-
6
-
7
-
8
-
9
-
10
-
11
-
12
-
13
-
14
-
15
-
16
-
17
-
18
-
19
-
20
-
21
-
22
-
23
-
24
-
25
-
26
-
27
-
28
-
29
-
30
-
31
-
32
-
33
-
34
-
35
-
36
-
37
-
38
-
39
-
40
-
41
-
42
-
43
-
44
-
45
-
46
-
47
-
48
-
49
-
50
-
51
-
52
-
53
-
54
-
55
-
56
-
57
-
58
-
59
-
60
-
61
-
62
-
63
-
64
-
65
-
66
-
67
-
68
-
69
-
70
-
71
-
72
-
73
-
74
-
75
-
76
-
77
-
78
-
79
-
80
-
81
-
82
-
83
-
84
-
85
-
86
-
87
-
88
-
89
-
90
-
91
-
92
-
93
-
94
-
95
-
96
-
97
-
98
-
99
-
100
-
101
-
102
-
103
-
104
-
105
-
106
-
107
-
108
-
109
-
 110
110 -
 111
111 -
 112
112 -
 113
113 -
 114
114 -
 115
115 -
 116
116 -
 117
117 -
 118
118 -
 119
119 -
 120
120 -
 121
121 -
 122
122 -
 123
123 -
 124
124 -
 125
125 -
 126
126 -
 127
127 -
 128
128 -
 129
129 -
 130
130 -
131
-
132
-
133
-
134
-
135
-
136
-
137
-
138
-
139
-
140
-
141
-
142
-
143
-
144
-
145
-
146
-
147
-
148
-
149
-
150
-
151
-
152
-
153
-
154
-
155
-
156
-
157
-
158
-
159
-
160
-
161
-
162
-
163
-
164
-
165
-
166
-
167
-
168
-
169
-
170
-
171
-
172
-
173
-
174
-
175
-
176
-
177
-
178
-
179
-
180
-
181
-
182
-
183
-
184
-
185
-
186
-
187
-
188
-
189
-
190
-
191
-
192
-
193
-
194
-
195
-
196
 |
 |

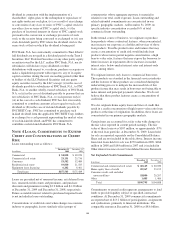
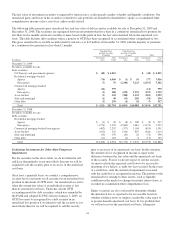
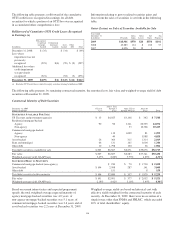
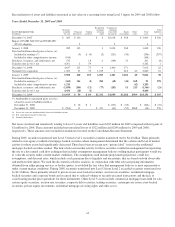
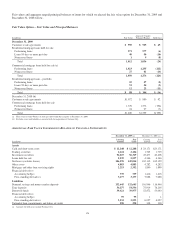
The following table presents a rollforward of the cumulative
OTTI credit losses recognized in earnings for all debt
securities for which a portion of an OTTI loss was recognized
in accumulated other comprehensive loss:
Rollforward of Cumulative OTTI Credit Losses Recognized
in Earnings (a)
In millions
Non-agency
residential
mortgage-
backed
Commercial
mortgage-
backed
Asset-
backed
Other
debt Total
December 31, 2008 $ (35) $ (34) $ (69)
Loss where
impairment was not
previously
recognized (223) $(6) (59) $ (9) (297)
Additional loss where
credit impairment
was previously
recognized (221) (52) (3) (276)
December 31, 2009 $(479) $(6) $(145) $(12) $(642)
(a) Excludes OTTI credit losses related to equity securities totaling $4 million in 2009.
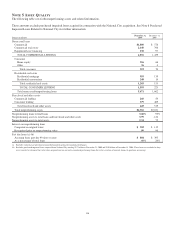
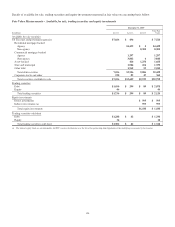
Information relating to gross realized securities gains and
losses from the sales of securities is set forth in the following
table.
Gains (Losses) on Sales of Securities Available for Sale
Year ended
December 31
In millions Proceeds
Gross
Gains
Gross
Losses
Net
Gains
Tax
Expense
2009 $18,901 $570 $20 $550 $192
2008 10,283 114 8 106 37
2007 6,056 20 19 1
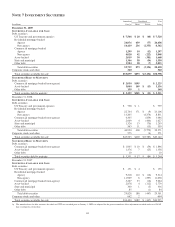
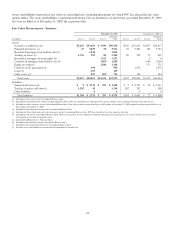
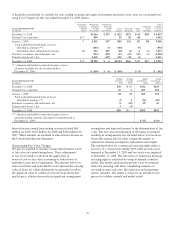
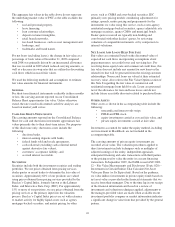
The following table presents, by remaining contractual maturity, the amortized cost, fair value and weighted-average yield of debt
securities at December 31, 2009.
Contractual Maturity of Debt Securities
December 31, 2009
Dollars in millions
1 Year or
Less
After 1 Year
through 5
Years
After 5 Years
through 10 Years
After 10
Years Total
S
ECURITIES
A
VAILABLE
F
OR
S
ALE
US Treasury and government agencies $ 33 $4,025 $3,148 $ 342 $ 7,548
Residential mortgage-backed
Agency 90 90 1,341 22,555 24,076
Non-agency 53 10,366 10,419
Commercial mortgage-backed
Agency 119 1,099 81 1,299
Non-agency 40 3,988 4,028
Asset-backed 26 364 315 1,314 2,019
State and municipal 46 131 165 1,004 1,346
Other debt 10 1,798 150 26 1,984
Total debt securities available for sale $ 205 $6,567 $6,271 $39,676 $52,719
Fair value $ 207 $6,607 $6,283 $37,341 $50,438
Weighted-average yield, GAAP basis 3.47% 2.82% 3.75% 4.65% 4.31%
S
ECURITIES
H
ELD TO
M
ATURITY
Commercial mortgage-backed (non-agency) $ 230 $ 70 $ 1,730 $ 2,030
Asset-backed $ 104 2,508 287 141 3,040
Other debt 151 8 159
Total debt securities held to maturity $ 104 $2,889 $ 357 $ 1,879 $ 5,229
Fair value $ 101 $2,991 $ 377 $ 2,052 $ 5,521
Weighted-average yield, GAAP basis 2.18% 4.02% 2.18% 5.45% 4.30%
Based on current interest rates and expected prepayment
speeds, the total weighted-average expected maturity of
agency mortgage-backed securities was 4.0 years, of
non-agency mortgage-backed securities was 5.1 years, of
commercial mortgage-backed securities was 3.4 years and of
asset-backed securities was 2.2 years at December 31, 2009.
Weighted-average yields are based on historical cost with
effective yields weighted for the contractual maturity of each
security. At December 31, 2009, there were no securities of a
single issuer, other than FNMA and FHLMC, which exceeded
10% of total shareholders’ equity.
116