PNC Bank 2009 Annual Report Download - page 37
Download and view the complete annual report
Please find page 37 of the 2009 PNC Bank annual report below. You can navigate through the pages in the report by either clicking on the pages listed below, or by using the keyword search tool below to find specific information within the annual report.-
 1
1 -
2
-
3
-
4
-
5
-
6
-
7
-
8
-
9
-
10
-
11
-
12
-
13
-
14
-
15
-
16
-
17
-
18
-
19
-
20
-
21
-
22
-
23
-
24
-
25
-
26
-
 27
27 -
 28
28 -
 29
29 -
 30
30 -
 31
31 -
 32
32 -
 33
33 -
 34
34 -
 35
35 -
 36
36 -
 37
37 -
 38
38 -
 39
39 -
 40
40 -
 41
41 -
 42
42 -
 43
43 -
 44
44 -
 45
45 -
 46
46 -
 47
47 -
48
-
49
-
50
-
51
-
52
-
53
-
54
-
55
-
56
-
57
-
58
-
59
-
60
-
61
-
62
-
63
-
64
-
65
-
66
-
67
-
68
-
69
-
70
-
71
-
72
-
73
-
74
-
75
-
76
-
77
-
78
-
79
-
80
-
81
-
82
-
83
-
84
-
85
-
86
-
87
-
88
-
89
-
90
-
91
-
92
-
93
-
94
-
95
-
96
-
97
-
98
-
99
-
100
-
101
-
102
-
103
-
104
-
105
-
106
-
107
-
108
-
109
-
110
-
111
-
112
-
113
-
114
-
115
-
116
-
117
-
118
-
119
-
120
-
121
-
122
-
123
-
124
-
125
-
126
-
127
-
128
-
129
-
130
-
131
-
132
-
133
-
134
-
135
-
136
-
137
-
138
-
139
-
140
-
141
-
142
-
143
-
144
-
145
-
146
-
147
-
148
-
149
-
150
-
151
-
152
-
153
-
154
-
155
-
156
-
157
-
158
-
159
-
160
-
161
-
162
-
163
-
164
-
165
-
166
-
167
-
168
-
169
-
170
-
171
-
172
-
173
-
174
-
175
-
176
-
177
-
178
-
179
-
180
-
181
-
182
-
183
-
184
-
185
-
186
-
187
-
188
-
189
-
190
-
191
-
192
-
193
-
194
-
195
-
196
 |
 |

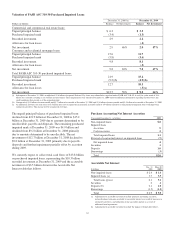
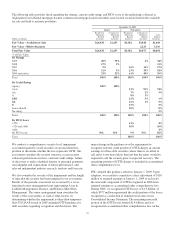
Accretable Net Interest – Purchased Impaired Loans
In billions
January 1, 2009 $3.7
Accretion (1.1)
Adjustments resulting from changes in purchase price
allocation .3
Reclassifications from nonaccretable to accretable .8
Disposals (.2)
December 31, 2009 $ 3.5
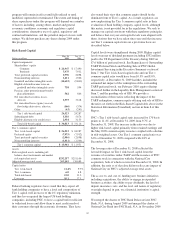
Net unfunded credit commitments are comprised of the
following:
Net Unfunded Credit Commitments
In millions
Dec. 31
2009
Dec. 31
2008
Commercial/commercial real estate (a) $ 60,143 $ 60,020
Home equity lines of credit 20,367 23,195
Consumer credit card and other unsecured
lines 18,800 20,207
Other 1,485 1,466
Total $100,795 $104,888
(a) Less than 4% of these amounts relate to commercial real estate.
Unfunded commitments are concentrated in our primary
geographic markets. Commitments to extend credit represent
arrangements to lend funds or provide liquidity subject to
specified contractual conditions. Commercial commitments
are reported net of participations, assignments and
syndications, primarily to financial institutions, totaling $13.2
billion at December 31, 2009 and $8.6 billion at December 31,
2008.
Unfunded liquidity facility commitments and standby bond
purchase agreements totaled $6.2 billion at December 31,
2009 and $7.0 billion at December 31, 2008 and are included
in the preceding table primarily within the “Commercial/
commercial real estate” category.
In addition to credit commitments, our net outstanding
standby letters of credit totaled $10.0 billion at December 31,
2009 and $10.3 billion at December 31, 2008. Standby letters
of credit commit us to make payments on behalf of our
customers if specified future events occur.
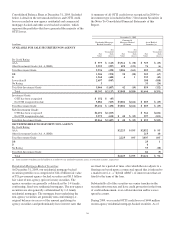
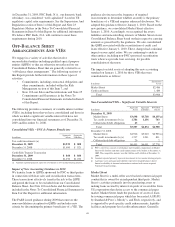
INVESTMENT SECURITIES
Details of Investment Securities
In millions
Amortized
Cost
Fair
Value
December 31, 2009
S
ECURITIES
A
VAILABLE FOR
S
ALE
Debt securities
US Treasury and government agencies $ 7,548 $ 7,520
Residential mortgage-backed
Agency 24,076 24,438
Non-agency 10,419 8,302
Commercial mortgage-backed
Agency 1,299 1,297
Non-agency 4,028 3,848
Asset-backed 2,019 1,668
State and municipal 1,346 1,350
Other debt 1,984 2,015
Corporate stocks and other 360 360
Total securities available for sale $53,079 $50,798
S
ECURITIES
H
ELD TO
M
ATURITY
Debt securities
Commercial mortgage-backed
(non-agency) $ 2,030 $ 2,225
Asset-backed 3,040 3,136
Other debt 159 160
Total securities held to maturity $ 5,229 $ 5,521
December 31, 2008
S
ECURITIES
A
VAILABLE FOR
S
ALE
Debt securities
US Treasury and government agencies $ 738 $ 739
Residential mortgage-backed
Agency 22,744 23,106
Non-agency 13,205 8,831
Commercial mortgage-backed
(non-agency) 4,305 3,446
Asset-backed 2,069 1,627
State and municipal 1,326 1,263
Other debt 563 559
Corporate stocks and other 575 571
Total securities available for sale $45,525 $40,142
S
ECURITIES
H
ELD TO
M
ATURITY
Debt securities
Commercial mortgage-backed
(non-agency) $ 1,945 $ 1,896
Asset-backed 1,376 1,358
Other debt 10 10
Total securities held to maturity $ 3,331 $ 3,264
The carrying amount of investment securities totaled $56.0
billion at December 31, 2009 and $43.5 billion at
December 31, 2008 and represented 21% of total assets at
December 31, 2009 compared with 15% of total assets at
December 31, 2008. The increase in securities of $12.6 billion
since December 31, 2008 primarily reflected the purchase of
US Treasury and government agency securities as well as
price appreciation in the available for sale portfolio, partially
offset by maturities, prepayments and sales.
33