PNC Bank 2009 Annual Report Download - page 145
Download and view the complete annual report
Please find page 145 of the 2009 PNC Bank annual report below. You can navigate through the pages in the report by either clicking on the pages listed below, or by using the keyword search tool below to find specific information within the annual report.-
 1
1 -
2
-
3
-
4
-
5
-
6
-
7
-
8
-
9
-
10
-
11
-
12
-
13
-
14
-
15
-
16
-
17
-
18
-
19
-
20
-
21
-
22
-
23
-
24
-
25
-
26
-
27
-
28
-
29
-
30
-
31
-
32
-
33
-
34
-
35
-
36
-
37
-
38
-
39
-
40
-
41
-
42
-
43
-
44
-
45
-
46
-
47
-
48
-
49
-
50
-
51
-
52
-
53
-
54
-
55
-
56
-
57
-
58
-
59
-
60
-
61
-
62
-
63
-
64
-
65
-
66
-
67
-
68
-
69
-
70
-
71
-
72
-
73
-
74
-
75
-
76
-
77
-
78
-
79
-
80
-
81
-
82
-
83
-
84
-
85
-
86
-
87
-
88
-
89
-
90
-
91
-
92
-
93
-
94
-
95
-
96
-
97
-
98
-
99
-
100
-
101
-
102
-
103
-
104
-
105
-
106
-
107
-
108
-
109
-
110
-
111
-
112
-
113
-
114
-
115
-
116
-
117
-
118
-
119
-
120
-
121
-
122
-
123
-
124
-
125
-
126
-
127
-
128
-
129
-
130
-
131
-
132
-
133
-
134
-
 135
135 -
 136
136 -
 137
137 -
 138
138 -
 139
139 -
 140
140 -
 141
141 -
 142
142 -
 143
143 -
 144
144 -
 145
145 -
 146
146 -
 147
147 -
 148
148 -
 149
149 -
 150
150 -
 151
151 -
 152
152 -
 153
153 -
 154
154 -
 155
155 -
156
-
157
-
158
-
159
-
160
-
161
-
162
-
163
-
164
-
165
-
166
-
167
-
168
-
169
-
170
-
171
-
172
-
173
-
174
-
175
-
176
-
177
-
178
-
179
-
180
-
181
-
182
-
183
-
184
-
185
-
186
-
187
-
188
-
189
-
190
-
191
-
192
-
193
-
194
-
195
-
196
 |
 |

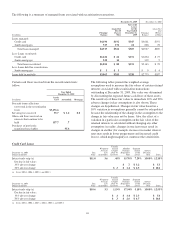
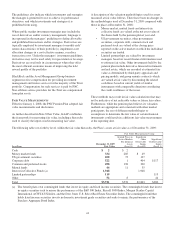
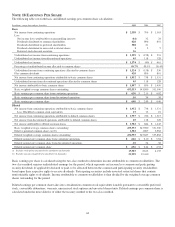
The weighted-average assumptions used (as of the beginning
of each year) to determine net periodic costs shown above
were as follows:
Net Periodic Cost Determination
Year ended December 31 2009 2008 2007
Discount rate
Qualified pension 6.05% 5.95% 5.70%
Nonqualified pension 5.90 5.75 5.60
Postretirement benefits 5.95 5.95 5.80
Rate of compensation increase (average) 4.00 4.00 4.00
Assumed health care cost trend rate
Initial trend 9.00 9.50 10.00
Ultimate trend 5.00 5.00 5.00
Year ultimate reached 2014 2014 2012
Expected long-term return on plan assets 8.25 8.25 8.25
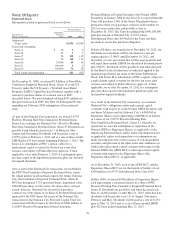
The weighted-average assumptions used (as of the end of each
year) to determine year-end obligations for pension and
postretirement benefits were as follows:
At December 31
2009 2008
Discount rate
Qualified pension 5.75% 6.05%
Nonqualified pension 5.15 5.90
Postretirement benefits 5.40 5.95
Rate of compensation increase (average) 4.00 4.00
Assumed health care cost trend rate
Initial trend 8.50 9.00
Ultimate trend 5.00 5.00
Year ultimate reached 2014 2014
The discount rate assumptions were determined independently
for each plan reflecting the duration of each plan’s
obligations. Specifically, a yield curve was produced for a
universe containing the majority of US-issued Aa grade
corporate bonds, all of which were non-callable (or callable
with make-whole provisions). Excluded from this yield curve
were the 10% of the bonds with the highest yields and the
10% with the lowest yields. For each plan, the discount rate
was determined as the level equivalent rate that would
produce the same present value obligation as that using spot
rates aligned with the projected benefit payments.
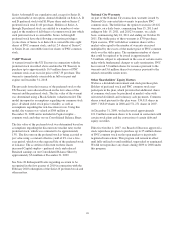
The expected return on plan assets is a long-term assumption
established by considering historical and anticipated returns of
the asset classes invested in by the pension plan and the
allocation strategy currently in place among those classes. We
review this assumption at each measurement date and adjust it
if warranted. This assumption will be decreased from 8.25%
to 8.00% for determining 2010 net periodic cost.
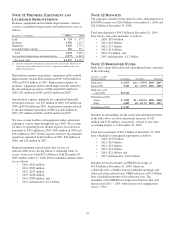
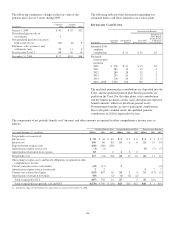
The health care cost trend rate assumptions shown in the
preceding tables relate only to the postretirement benefit
plans. A one-percentage-point change in assumed health care
cost trend rates would have the following effects:
Year ended December 31, 2009
In millions Increase Decrease
Effect on total service and interest cost $1 $(1)
Effect on year-end benefit obligation $12 $(11)
Under GAAP, unamortized actuarial gains and losses and
prior service costs and credits are recognized in AOCI each
December 31, with amortization of these amounts through net
periodic benefit cost. The estimated amounts that will be
amortized in 2010 are as follows:
2010 Estimate
Year ended December 31
In millions
Qualified
Pension
Nonqualified
Pension
Postretirement
Benefits
Prior service cost (credit) $ (7) $1 $(3)
Net actuarial loss 35 3
Total $28 $4 $(3)
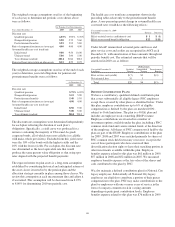
D
EFINED
C
ONTRIBUTION
P
LANS
We have a contributory, qualified defined contribution plan
that covers substantially all eligible legacy PNC employees
except those covered by other plans as identified below. Under
this plan, employee contributions up to 6% of eligible
compensation as defined by the plan are matched 100%,
subject to Code limitations. The plan is a 401(k) plan and
includes an employee stock ownership (ESOP) feature.
Employee contributions are invested in a number of
investment options available under the plan, including a PNC
common stock fund and various mutual funds, at the direction
of the employee. All shares of PNC common stock held by the
plan are part of the ESOP. Employee contributions to the plan
for 2009, 2008 and 2007 were matched primarily by shares of
PNC common stock held in treasury or reserve, except in the
case of those participants who have exercised their
diversification election rights to have their matching portion in
other investments available within the plan. Employee
benefits expense related to this plan was $61 million in 2009,
$57 million in 2008 and $52 million in 2007. We measured
employee benefits expense as the fair value of the shares and
cash contributed to the plan by PNC.
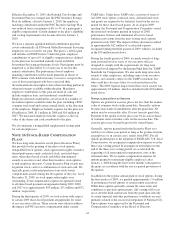
We also maintain a defined contribution plan for National City
legacy employees. Substantially all National City legacy
employees are eligible to contribute a portion of their pretax
compensation to the plan. PNC may make contributions to the
plan for employees with one or more years of service in the
form of company common stock in varying amounts
depending on participant contribution levels. Employee
benefits expense related to this plan was $76 million in 2009.
141