PNC Bank 2009 Annual Report Download - page 41
Download and view the complete annual report
Please find page 41 of the 2009 PNC Bank annual report below. You can navigate through the pages in the report by either clicking on the pages listed below, or by using the keyword search tool below to find specific information within the annual report.-
 1
1 -
2
-
3
-
4
-
5
-
6
-
7
-
8
-
9
-
10
-
11
-
12
-
13
-
14
-
15
-
16
-
17
-
18
-
19
-
20
-
21
-
22
-
23
-
24
-
25
-
26
-
27
-
28
-
29
-
30
-
 31
31 -
 32
32 -
 33
33 -
 34
34 -
 35
35 -
 36
36 -
 37
37 -
 38
38 -
 39
39 -
 40
40 -
 41
41 -
 42
42 -
 43
43 -
 44
44 -
 45
45 -
 46
46 -
 47
47 -
 48
48 -
 49
49 -
 50
50 -
 51
51 -
52
-
53
-
54
-
55
-
56
-
57
-
58
-
59
-
60
-
61
-
62
-
63
-
64
-
65
-
66
-
67
-
68
-
69
-
70
-
71
-
72
-
73
-
74
-
75
-
76
-
77
-
78
-
79
-
80
-
81
-
82
-
83
-
84
-
85
-
86
-
87
-
88
-
89
-
90
-
91
-
92
-
93
-
94
-
95
-
96
-
97
-
98
-
99
-
100
-
101
-
102
-
103
-
104
-
105
-
106
-
107
-
108
-
109
-
110
-
111
-
112
-
113
-
114
-
115
-
116
-
117
-
118
-
119
-
120
-
121
-
122
-
123
-
124
-
125
-
126
-
127
-
128
-
129
-
130
-
131
-
132
-
133
-
134
-
135
-
136
-
137
-
138
-
139
-
140
-
141
-
142
-
143
-
144
-
145
-
146
-
147
-
148
-
149
-
150
-
151
-
152
-
153
-
154
-
155
-
156
-
157
-
158
-
159
-
160
-
161
-
162
-
163
-
164
-
165
-
166
-
167
-
168
-
169
-
170
-
171
-
172
-
173
-
174
-
175
-
176
-
177
-
178
-
179
-
180
-
181
-
182
-
183
-
184
-
185
-
186
-
187
-
188
-
189
-
190
-
191
-
192
-
193
-
194
-
195
-
196
 |
 |

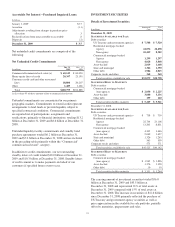
December 31, 2009, $397 million of the credit losses related to
securities rated below investment grade. As of December 31,
2009, the noncredit portion of OTTI losses recorded in
accumulated other comprehensive loss for non-agency
residential mortgage-backed securities totaled $1.1 billion and
the related securities had a fair value of $2.6 billion.
The fair value of sub-investment grade investment securities
for which we have not recorded an OTTI credit loss as of
December 31, 2009 totaled $2.6 billion, with unrealized net
losses of $658 million. The results of our security-level
assessments indicate that we will recover the entire cost basis
of these securities. Note 7 Investment Securities in the Notes
To Consolidated Financial Statements of this Report provides
further detail regarding our process for assessing OTTI for
these securities.
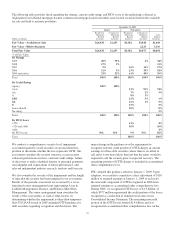
Commercial Mortgage-Backed Securities
The fair value of the non-agency commercial mortgage-
backed securities portfolio was $6.1 billion at December 31,
2009 and consisted of fixed-rate, private-issuer securities
collateralized by non-residential properties, primarily retail
properties, office buildings, and multi-family housing. The
agency commercial mortgage-backed securities portfolio was
$1.3 billion fair value at December 31, 2009 consisting of
multi-family housing. Substantially all of the securities are the
most senior tranches in the subordination structure.
We recorded OTTI credit losses of $6 million on non-agency
commercial mortgage-backed securities during 2009. The
remaining fair value of the securities for which OTTI was
recorded approximates zero. All of the credit-impaired
securities were rated below investment grade.
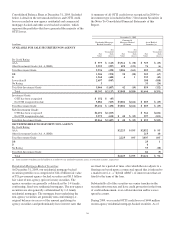
Asset-Backed Securities
The fair value of the asset-backed securities portfolio was $4.8
billion at December 31, 2009 and consisted of fixed-rate and
floating-rate, private-issuer securities collateralized primarily
by various consumer credit products, including residential
mortgage loans, credit cards, and automobile loans.
Substantially all of the securities are senior tranches in the
securitization structure and have credit protection in the form
of credit enhancement, over-collateralization and/or excess
spread accounts.
We recorded OTTI credit losses of $111 million on asset-
backed securities during 2009. All of the securities were
collateralized by first and second lien residential mortgage
loans and were rated below investment grade. As of
December 31, 2009, the noncredit portion of OTTI losses
recorded in accumulated other comprehensive loss for asset-
backed securities totaled $221 million and the related
securities had a fair value of $562 million.
For the sub-investment grade investment securities for which
we have not recorded an OTTI loss through December 31,
2009, the remaining fair value was $381 million, with
unrealized net losses of $110 million. The results of our
security-level assessments indicate that we will recover the
entire cost basis of these securities. Note 7 Investment
Securities in the Notes To Consolidated Financial Statements
of this Report provides further detail regarding our process for
assessing OTTI for these securities.
If the current housing and economic conditions were to
continue for the foreseeable future or worsen, if market
volatility and illiquidity were to continue or worsen, or if
market interest rates were to increase appreciably, the
valuation of our investment securities portfolio could continue
to be adversely affected and we could incur additional OTTI
credit losses that would impact our Consolidated Income
Statement.
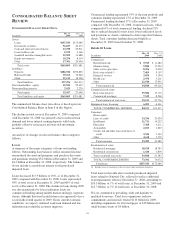
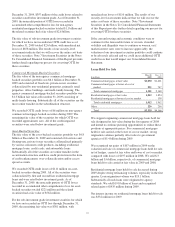
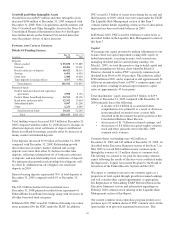
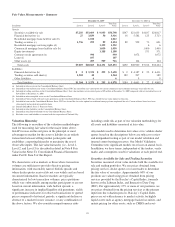
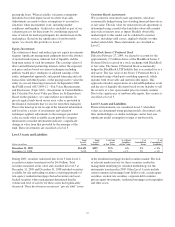
Loans Held For Sale
In millions
Dec. 31
2009
Dec. 31
2008
Commercial mortgages at fair value $1,050 $1,401
Commercial mortgages at lower of cost or
market 251 747
Total commercial mortgages 1,301 2,148
Residential mortgages at fair value 1,012 1,824
Residential mortgages at lower of cost or market 138
Total residential mortgages 1,012 1,962
Other 226 256
Total $2,539 $4,366
We stopped originating commercial mortgage loans held for
sale designated at fair value during the first quarter of 2008
and intend to continue pursuing opportunities to reduce these
positions at appropriate prices. For commercial mortgages
held for sale carried at the lower of cost or market, strong
origination volumes partially offset sales to government
agencies of $5.4 billion during 2009.
We recognized net gains of $107 million in 2009 on the
valuation and sale of commercial mortgage loans held for sale,
net of hedges, carried at fair value and lower of cost or market
compared with losses of $197 million in 2008. We sold $.3
billion and $.6 billion, respectively, of commercial mortgage
loans held for sale carried at fair value in 2009 and 2008.
Residential mortgage loans held for sale decreased during
2009 despite strong refinancing volumes, especially in the first
quarter. Loan origination volume was $19.1 billion.
Substantially all such loans were originated to agency
standards. We sold $19.8 billion of loans and recognized
related gains of $435 million during 2009.
Net interest income on residential mortgage loans held for sale
was $332 million for 2009.
37