PNC Bank 2009 Annual Report Download - page 84
Download and view the complete annual report
Please find page 84 of the 2009 PNC Bank annual report below. You can navigate through the pages in the report by either clicking on the pages listed below, or by using the keyword search tool below to find specific information within the annual report.-
 1
1 -
2
-
3
-
4
-
5
-
6
-
7
-
8
-
9
-
10
-
11
-
12
-
13
-
14
-
15
-
16
-
17
-
18
-
19
-
20
-
21
-
22
-
23
-
24
-
25
-
26
-
27
-
28
-
29
-
30
-
31
-
32
-
33
-
34
-
35
-
36
-
37
-
38
-
39
-
40
-
41
-
42
-
43
-
44
-
45
-
46
-
47
-
48
-
49
-
50
-
51
-
52
-
53
-
54
-
55
-
56
-
57
-
58
-
59
-
60
-
61
-
62
-
63
-
64
-
65
-
66
-
67
-
68
-
69
-
70
-
71
-
72
-
73
-
 74
74 -
 75
75 -
 76
76 -
 77
77 -
 78
78 -
 79
79 -
 80
80 -
 81
81 -
 82
82 -
 83
83 -
 84
84 -
 85
85 -
 86
86 -
 87
87 -
 88
88 -
 89
89 -
 90
90 -
 91
91 -
 92
92 -
 93
93 -
 94
94 -
95
-
96
-
97
-
98
-
99
-
100
-
101
-
102
-
103
-
104
-
105
-
106
-
107
-
108
-
109
-
110
-
111
-
112
-
113
-
114
-
115
-
116
-
117
-
118
-
119
-
120
-
121
-
122
-
123
-
124
-
125
-
126
-
127
-
128
-
129
-
130
-
131
-
132
-
133
-
134
-
135
-
136
-
137
-
138
-
139
-
140
-
141
-
142
-
143
-
144
-
145
-
146
-
147
-
148
-
149
-
150
-
151
-
152
-
153
-
154
-
155
-
156
-
157
-
158
-
159
-
160
-
161
-
162
-
163
-
164
-
165
-
166
-
167
-
168
-
169
-
170
-
171
-
172
-
173
-
174
-
175
-
176
-
177
-
178
-
179
-
180
-
181
-
182
-
183
-
184
-
185
-
186
-
187
-
188
-
189
-
190
-
191
-
192
-
193
-
194
-
195
-
196
 |
 |
gains of $102 million and gains related to our commercial
mortgage loans held for sale, net of hedges, of $3 million.
Provision For Credit Losses
The provision for credit losses totaled $1.5 billion for 2008
compared with $315 million for 2007. Of the total 2008
provision, $990 million was recorded in the fourth quarter,
including $504 million of additional provision recorded on
December 31, 2008 to conform the National City loan
reserving methodology with ours. The differences in
methodology include granularity of loss computations,
statistical and quantitative factors rather than qualitative
assessment, and the extent of current appraisals and risk
assessments.
In addition to the impact of National City, the higher provision
in 2008 compared with the prior year was driven by general
credit quality migration, including residential real estate
development and commercial real estate exposure, an increase
in net charge-offs, and growth in nonperforming loans.
Growth in our total credit exposure also contributed to the
higher provision amounts in both comparisons.
Noninterest Expense
Total noninterest expense was $3.685 billion for 2008 and
$3.652 billion for 2007, an increase of $33 million, or 1%.
Higher noninterest expense in 2008 compared with 2007
primarily resulted from investments in growth initiatives,
including acquisitions, partially offset by the impact of the
sale of Hilliard Lyons and disciplined expense management.
Integration costs included in noninterest expense totaled $115
million for 2008, including $79 million in the fourth quarter,
and $102 million for 2007. Fourth quarter 2008 integration
costs included $71 million related to our National City
acquisition.
Noninterest expense for 2008 included the benefit of the
reversal of $46 million of the $82 million Visa
indemnification liability that we established in the fourth
quarter of 2007.
E
FFECTIVE
T
AX
R
ATE
Our effective tax rate was 27.2% for 2008 and 29.2% for
2007.
C
ONSOLIDATED
B
ALANCE
S
HEET
R
EVIEW
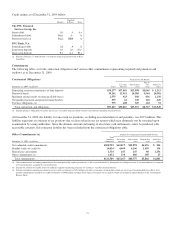
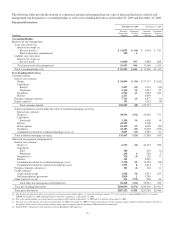
Loans
Loans increased $107.2 billion as of December 31, 2008
compared with December 31, 2007. Our National City
acquisition added $99.7 billion of loans, including $34.3
billion of commercial, $16.0 billion of commercial real estate,
$30.5 billion of consumer and $10.6 billion of residential
mortgage loans.
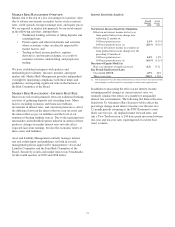
Investment Securities
Total investment securities at December 31, 2008 were $43.5
billion compared with $30.2 billion at December 31, 2007.
Securities added with the National City acquisition at
December 31, 2008 totaled $13.3 billion and were primarily
US government agency residential mortgage-backed
securities. Securities represented 15% of total assets at
December 31, 2008 and 22% of total assets at December 31,
2007.
At December 31, 2008, the investment securities balance
included a net unrealized loss of $5.4 billion, which
represented the difference between fair value and amortized
cost. The comparable amount at December 31, 2007 was a net
unrealized loss of $265 million. The expected weighted-
average life of investment securities (excluding corporate
stocks and other) was 3 years and 1 month at December 31,
2008 and 3 years and 6 months at December 31, 2007.
Loans Held For Sale
Loans held for sale totaled $4.4 billion at December 31, 2008
compared with $3.9 billion at December 31, 2007. The
acquisition of National City added approximately $2.2 billion
of loans held for sale at December 31, 2008, primarily 1-4
family conforming residential mortgages.
Loans held for sale included education loans held for sale of
$1.5 billion at December 31, 2007. We transferred these loans
at lower of cost or market value from held for sale to the loan
portfolio in February 2008 due to the impact at that time of
liquidity issues on the secondary markets for education loans.
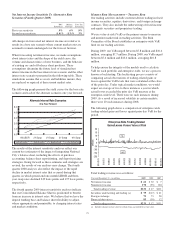
Asset Quality
Total nonperforming assets at December 31, 2008 increased
$1.7 billion, to $2.2 billion, from the balance at December 31,
2007. Our nonperforming assets represented .75% of total
assets at December 31, 2008 compared with .36% at
December 31, 2007. The increase in nonperforming assets
reflected higher nonaccrual residential real estate development
loans and loans in related sectors, and the addition of $738
million of nonperforming assets related to National City.
At December 31, 2008, our largest nonperforming asset was
approximately $36 million and our average nonperforming
loan associated with commercial lending was less than $1
million.
Goodwill and Other Intangible Assets
The sum of goodwill and other intangible assets increased
$2.1 billion at December 31, 2008 compared with the prior
year end, to $11.7 billion. We added $.6 billion of core deposit
and other relationship intangible assets and $1.2 billion of
mortgage servicing rights in connection with the National City
acquisition at December 31, 2008. In addition, our Sterling
acquisition added $.6 billion of goodwill during 2008. Our
Hilliard Lyons divestiture reduced goodwill by $.1 billion in
2008.
80