PNC Bank 2009 Annual Report Download - page 33
Download and view the complete annual report
Please find page 33 of the 2009 PNC Bank annual report below. You can navigate through the pages in the report by either clicking on the pages listed below, or by using the keyword search tool below to find specific information within the annual report.-
 1
1 -
2
-
3
-
4
-
5
-
6
-
7
-
8
-
9
-
10
-
11
-
12
-
13
-
14
-
15
-
16
-
17
-
18
-
19
-
20
-
21
-
22
-
 23
23 -
 24
24 -
 25
25 -
 26
26 -
 27
27 -
 28
28 -
 29
29 -
 30
30 -
 31
31 -
 32
32 -
 33
33 -
 34
34 -
 35
35 -
 36
36 -
 37
37 -
 38
38 -
 39
39 -
 40
40 -
 41
41 -
 42
42 -
 43
43 -
44
-
45
-
46
-
47
-
48
-
49
-
50
-
51
-
52
-
53
-
54
-
55
-
56
-
57
-
58
-
59
-
60
-
61
-
62
-
63
-
64
-
65
-
66
-
67
-
68
-
69
-
70
-
71
-
72
-
73
-
74
-
75
-
76
-
77
-
78
-
79
-
80
-
81
-
82
-
83
-
84
-
85
-
86
-
87
-
88
-
89
-
90
-
91
-
92
-
93
-
94
-
95
-
96
-
97
-
98
-
99
-
100
-
101
-
102
-
103
-
104
-
105
-
106
-
107
-
108
-
109
-
110
-
111
-
112
-
113
-
114
-
115
-
116
-
117
-
118
-
119
-
120
-
121
-
122
-
123
-
124
-
125
-
126
-
127
-
128
-
129
-
130
-
131
-
132
-
133
-
134
-
135
-
136
-
137
-
138
-
139
-
140
-
141
-
142
-
143
-
144
-
145
-
146
-
147
-
148
-
149
-
150
-
151
-
152
-
153
-
154
-
155
-
156
-
157
-
158
-
159
-
160
-
161
-
162
-
163
-
164
-
165
-
166
-
167
-
168
-
169
-
170
-
171
-
172
-
173
-
174
-
175
-
176
-
177
-
178
-
179
-
180
-
181
-
182
-
183
-
184
-
185
-
186
-
187
-
188
-
189
-
190
-
191
-
192
-
193
-
194
-
195
-
196
 |
 |
P
ROVISION
F
OR
C
REDIT
L
OSSES
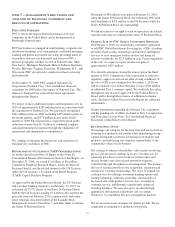
The provision for credit losses totaled $3.9 billion for 2009
compared with $1.5 billion for 2008. The provision for credit
losses for 2009 was in excess of net charge-offs of $2.7 billion
primarily due to required increases to our allowance for loan
and lease losses reflecting continued deterioration in the credit
markets and the resulting increase in nonperforming loans.
The Credit Risk Management portion of the Risk Management
section of this Item 7 includes additional information
regarding factors impacting the provision for credit losses. See
also Item 1A Risk Factors and the Cautionary Statement
Regarding Forward-Looking Information section of Item 7 of
this Report.
We expect the provision for credit losses in the first quarter of
2010 to be similar to the provision recognized in the third
quarter of 2009.
N
ONINTEREST
E
XPENSE
Noninterest expense for 2009 was $9.1 billion compared with
$3.7 billion in 2008. Acquisition cost savings totaled $800
million in 2009. The increase was substantially related to
National City. We also recorded a special FDIC assessment of
$133 million in the second quarter of 2009, which was
intended to build the FDIC’s Deposit Insurance Fund.
Integration costs included in noninterest expense totaled $421
million in 2009 compared with $122 million in 2008. Our
quarterly run rate of acquisition cost savings related to
National City increased to $300 million in the fourth quarter
of 2009, or $1.2 billion per year.
We anticipate meaningful expense reductions in 2010, driven
by acquisition cost saves, as we continue to focus on
effectively managing expenses and achieving cost savings
targets and credit cost improvements.
E
FFECTIVE
T
AX
R
ATE
Our effective tax rate was 26.9% for 2009 and 27.2% for
2008. The decrease in the effective tax rate for 2009 compared
with 2008 was principally due to additional tax expense in
2008 related to the sale of Hilliard Lyons partially offset by
additional tax expense associated with an increase in the level
of pretax earnings in 2009.
29