PNC Bank 2009 Annual Report Download - page 60
Download and view the complete annual report
Please find page 60 of the 2009 PNC Bank annual report below. You can navigate through the pages in the report by either clicking on the pages listed below, or by using the keyword search tool below to find specific information within the annual report.-
 1
1 -
2
-
3
-
4
-
5
-
6
-
7
-
8
-
9
-
10
-
11
-
12
-
13
-
14
-
15
-
16
-
17
-
18
-
19
-
20
-
21
-
22
-
23
-
24
-
25
-
26
-
27
-
28
-
29
-
30
-
31
-
32
-
33
-
34
-
35
-
36
-
37
-
38
-
39
-
40
-
41
-
42
-
43
-
44
-
45
-
46
-
47
-
48
-
49
-
 50
50 -
 51
51 -
 52
52 -
 53
53 -
 54
54 -
 55
55 -
 56
56 -
 57
57 -
 58
58 -
 59
59 -
 60
60 -
 61
61 -
 62
62 -
 63
63 -
 64
64 -
 65
65 -
 66
66 -
 67
67 -
 68
68 -
 69
69 -
 70
70 -
71
-
72
-
73
-
74
-
75
-
76
-
77
-
78
-
79
-
80
-
81
-
82
-
83
-
84
-
85
-
86
-
87
-
88
-
89
-
90
-
91
-
92
-
93
-
94
-
95
-
96
-
97
-
98
-
99
-
100
-
101
-
102
-
103
-
104
-
105
-
106
-
107
-
108
-
109
-
110
-
111
-
112
-
113
-
114
-
115
-
116
-
117
-
118
-
119
-
120
-
121
-
122
-
123
-
124
-
125
-
126
-
127
-
128
-
129
-
130
-
131
-
132
-
133
-
134
-
135
-
136
-
137
-
138
-
139
-
140
-
141
-
142
-
143
-
144
-
145
-
146
-
147
-
148
-
149
-
150
-
151
-
152
-
153
-
154
-
155
-
156
-
157
-
158
-
159
-
160
-
161
-
162
-
163
-
164
-
165
-
166
-
167
-
168
-
169
-
170
-
171
-
172
-
173
-
174
-
175
-
176
-
177
-
178
-
179
-
180
-
181
-
182
-
183
-
184
-
185
-
186
-
187
-
188
-
189
-
190
-
191
-
192
-
193
-
194
-
195
-
196
 |
 |
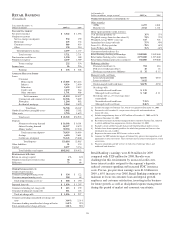
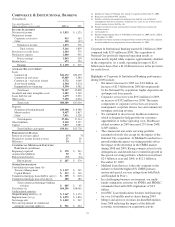
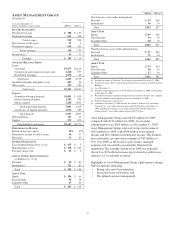
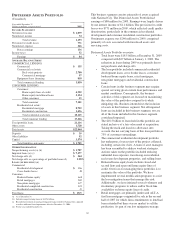
Assets under administration of $205 billion at December 31,
2009 increased $61 billion compared with the balance at
December 31, 2008. Including National City, assets under
administration were $228 billion at December 31, 2008.
Discretionary assets under management of $103 billion at
December 31, 2009 increased $46 billion compared with the
prior year-end balance. The increase in discretionary assets
under management is attributable to the National City
acquisition.
Nondiscretionary assets under administration of $102 billion
at December 31, 2009 increased $15 billion compared with the
balance at December 31, 2008. This increase was driven by
the National City acquisition, somewhat mitigated by a
decline in institutional assets related to the exit of a noncore
product offering and other National City integration impacts.
Total revenue for 2009 was $919 million compared with $559
million for 2008. Net interest income of $308 million reflected
additional revenue from the National City loan and deposit
portfolios and strong yields from the loan portfolio. The year-
over-year increase in net interest income was partially offset
by lower interest credits assigned to the segment’s deposits in
this low interest rate environment. Noninterest income of $611
million increased $182 million compared with 2008 primarily
in asset management fees. The growth was attributable to the
National City acquisition, client retention and new business
development activities.
The provision for credit losses of $97 million increased from
$6 million in 2008 as loan loss reserves were increased
beyond charge-offs due to credit quality deterioration. Net
charge-offs were $63 million for 2009 and $2 million for
2008.
Noninterest expense of $654 million increased $291 million in
2009 compared with 2008. The increase is attributable to the
National City acquisition. Implementation of various
integration-related initiatives has mitigated this increase in
expenses. Expense management remains a key focal point for
this business and the implementation of efficiency initiatives
will continue throughout 2010.
Balance sheet activity for 2009 reflected both core and
acquisition-related growth. Average loans of $6.7 billion
increased $3.9 billion compared with 2008. Average total
deposits of $7.0 billion increased $3.0 billion compared with
2008. During the economic downturn, customers shifted from
riskier equity investments into safer deposit products,
resulting in solid money market and demand deposit growth.
56