PNC Bank 2009 Annual Report Download - page 173
Download and view the complete annual report
Please find page 173 of the 2009 PNC Bank annual report below. You can navigate through the pages in the report by either clicking on the pages listed below, or by using the keyword search tool below to find specific information within the annual report.-
 1
1 -
2
-
3
-
4
-
5
-
6
-
7
-
8
-
9
-
10
-
11
-
12
-
13
-
14
-
15
-
16
-
17
-
18
-
19
-
20
-
21
-
22
-
23
-
24
-
25
-
26
-
27
-
28
-
29
-
30
-
31
-
32
-
33
-
34
-
35
-
36
-
37
-
38
-
39
-
40
-
41
-
42
-
43
-
44
-
45
-
46
-
47
-
48
-
49
-
50
-
51
-
52
-
53
-
54
-
55
-
56
-
57
-
58
-
59
-
60
-
61
-
62
-
63
-
64
-
65
-
66
-
67
-
68
-
69
-
70
-
71
-
72
-
73
-
74
-
75
-
76
-
77
-
78
-
79
-
80
-
81
-
82
-
83
-
84
-
85
-
86
-
87
-
88
-
89
-
90
-
91
-
92
-
93
-
94
-
95
-
96
-
97
-
98
-
99
-
100
-
101
-
102
-
103
-
104
-
105
-
106
-
107
-
108
-
109
-
110
-
111
-
112
-
113
-
114
-
115
-
116
-
117
-
118
-
119
-
120
-
121
-
122
-
123
-
124
-
125
-
126
-
127
-
128
-
129
-
130
-
131
-
132
-
133
-
134
-
135
-
136
-
137
-
138
-
139
-
140
-
141
-
142
-
143
-
144
-
145
-
146
-
147
-
148
-
149
-
150
-
151
-
152
-
153
-
154
-
155
-
156
-
157
-
158
-
159
-
160
-
161
-
162
-
 163
163 -
 164
164 -
 165
165 -
 166
166 -
 167
167 -
 168
168 -
 169
169 -
 170
170 -
 171
171 -
 172
172 -
 173
173 -
 174
174 -
 175
175 -
 176
176 -
 177
177 -
 178
178 -
 179
179 -
 180
180 -
 181
181 -
 182
182 -
 183
183 -
184
-
185
-
186
-
187
-
188
-
189
-
190
-
191
-
192
-
193
-
194
-
195
-
196
 |
 |

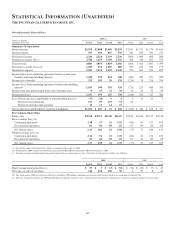
S
TATISTICAL
I
NFORMATION
(U
NAUDITED
)
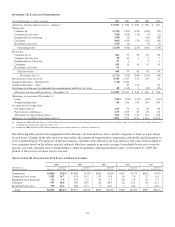
THE PNC FINANCIAL SERVICES GROUP, INC.
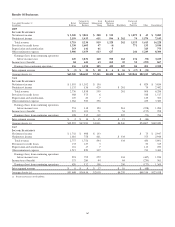
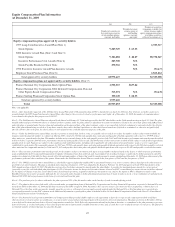
Selected Quarterly Financial Data
Dollars in millions,
except per share data
2009 (a) 2008
Fourth Third Second First Fourth Third Second First
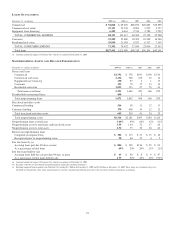
Summary Of Operations
Interest income $2,939 $2,888 $3,000 $3,259 $1,541 $1,571 $1,574 $1,615
Interest expense 593 664 807 939 541 565 590 751
Net interest income 2,346 2,224 2,193 2,320 1,000 1,006 984 864
Noninterest income (b) (c) 2,540 1,629 1,610 1,366 468 416 823 735
Total revenue 4,886 3,853 3,803 3,686 1,468 1,422 1,807 1,599
Provision for credit losses (d) 1,049 914 1,087 880 990 190 186 151
Noninterest expense 2,209 2,214 2,492 2,158 959 947 920 859
Income (loss) from continuing operations before income taxes
(benefit) and noncontrolling interests 1,628 725 224 648 (481) 285 701 589
Income taxes (benefit) 525 185 29 128 (210) 58 216 234
Income (loss) from continuing operations before noncontrolling
interests 1,103 540 195 520 (271) 227 485 355
Income from discontinued operations, net of income taxes 4191210 25 32 32 29
Net income (loss) 1,107 559 207 530 (246) 259 517 384
Less: Net income (loss) attributable to noncontrolling interests (37) (20) 9 4 21112 7
Preferred stock dividends 119 99 119 51 21
Preferred stock discount accretion 14 13 14 15
Net income (loss) attributable to common shareholders $1,011 $ 467 $ 65 $ 460 $ (269) $ 248 $ 505 $ 377
Per Common Share Data
Book value $47.68 $45.52 $42.00 $41.67 $39.44 $39.44 $42.17 $42.26
Basic earnings (loss) (e)
Continuing operations 2.18 .97 .11 1.02 (.84) .63 1.37 1.02
Discontinued operations .01 .04 .03 .02 .07 .09 .09 .09
Net income (loss) 2.19 1.01 .14 1.04 (.77) .72 1.46 1.11
Diluted earnings (loss) (e)
Continuing operations 2.16 .96 .11 1.01 (.84) .60 1.36 1.00
Discontinued operations .01 .04 .03 .02 .07 .10 .09 .09
Net income (loss) 2.17 1.00 .14 1.03 (.77) .70 1.45 1.09
(a) Includes the impact of National City, which we acquired on December 31, 2008.
(b) Fourth quarter 2009 included a $1.076 billion gain related to BlackRock's acquisition of BGI on December 1, 2009.
(c) Noninterest income included equity management gains /(losses) and net gains on sales of securities in each quarter as follows (in millions):
2009 2008
Fourth Third Second First Fourth Third Second First
Equity management gains/(losses) $ 35 $ 3 $ (13) $ (52) $ (16) $ (24) $ (7) $ 23
Net gains on sales of securities 144 168 182 56 255 841
(d) The fourth quarter 2008 provision for credit losses included a $504 million conforming provision for credit losses related to our acquisition of National City.
(e) The sum of quarterly amounts for 2009 and 2008 does not equal the respective year’s amount because the quarterly calculations are based on a changing number of average shares.
169