PNC Bank 2009 Annual Report Download - page 135
Download and view the complete annual report
Please find page 135 of the 2009 PNC Bank annual report below. You can navigate through the pages in the report by either clicking on the pages listed below, or by using the keyword search tool below to find specific information within the annual report.-
 1
1 -
2
-
3
-
4
-
5
-
6
-
7
-
8
-
9
-
10
-
11
-
12
-
13
-
14
-
15
-
16
-
17
-
18
-
19
-
20
-
21
-
22
-
23
-
24
-
25
-
26
-
27
-
28
-
29
-
30
-
31
-
32
-
33
-
34
-
35
-
36
-
37
-
38
-
39
-
40
-
41
-
42
-
43
-
44
-
45
-
46
-
47
-
48
-
49
-
50
-
51
-
52
-
53
-
54
-
55
-
56
-
57
-
58
-
59
-
60
-
61
-
62
-
63
-
64
-
65
-
66
-
67
-
68
-
69
-
70
-
71
-
72
-
73
-
74
-
75
-
76
-
77
-
78
-
79
-
80
-
81
-
82
-
83
-
84
-
85
-
86
-
87
-
88
-
89
-
90
-
91
-
92
-
93
-
94
-
95
-
96
-
97
-
98
-
99
-
100
-
101
-
102
-
103
-
104
-
105
-
106
-
107
-
108
-
109
-
110
-
111
-
112
-
113
-
114
-
115
-
116
-
117
-
118
-
119
-
120
-
121
-
122
-
123
-
124
-
 125
125 -
 126
126 -
 127
127 -
 128
128 -
 129
129 -
 130
130 -
 131
131 -
 132
132 -
 133
133 -
 134
134 -
 135
135 -
 136
136 -
 137
137 -
 138
138 -
 139
139 -
 140
140 -
 141
141 -
 142
142 -
 143
143 -
 144
144 -
 145
145 -
146
-
147
-
148
-
149
-
150
-
151
-
152
-
153
-
154
-
155
-
156
-
157
-
158
-
159
-
160
-
161
-
162
-
163
-
164
-
165
-
166
-
167
-
168
-
169
-
170
-
171
-
172
-
173
-
174
-
175
-
176
-
177
-
178
-
179
-
180
-
181
-
182
-
183
-
184
-
185
-
186
-
187
-
188
-
189
-
190
-
191
-
192
-
193
-
194
-
195
-
196
 |
 |

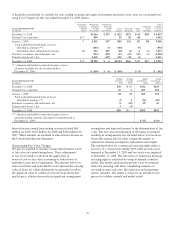
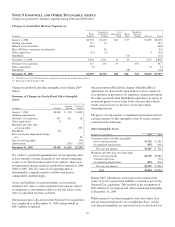
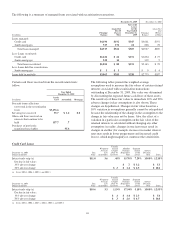
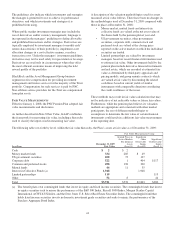
The following is a summary of managed loans associated with securitization transactions.
December 31, 2009 December 31, 2008
In millions
Principal
Balance
Loans Past
Due 30
Days or
More
Net Credit
Losses
for the
Year Ended
December 31,
2009
Principal
Balance
Loans Past
Due
30 Days
or More
Loans managed
Credit card $4,190 $192 $345 $4,061 $191
Jumbo mortgages 729 174 24 866 78
Total loans managed $4,919 $366 $369 $4,927 $269
Less: Loans securitized
Credit card $1,622 $ 66 $131 $1,824 $ 73
Jumbo mortgages 232 14 319 5
Total loans securitized $1,854 $ 80 $131 $2,143 $ 78
Less: Loans held for securitization
Jumbo mortgages $3 $3 $9 $4
Loans held in portfolio $3,062 $283 $238 $2,775 $187
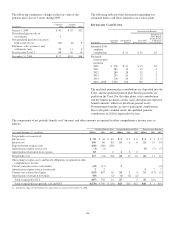
Certain cash flows received from the securitization trusts
follow:
Year Ended
December 31, 2009
In millions
Credit
Card Automobile Mortgage
Proceeds from collections
reinvested in the securitization
trusts $3,476.6
Servicing fees received 35.7 $ 1.4 $.8
Other cash flows received on
interests that continue to be
held 157.7 .7
Purchases of previously
transferred receivables 95.6
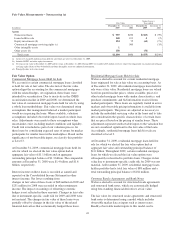
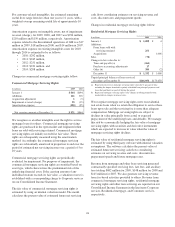
The following tables present the weighted-average
assumptions used to measure the fair values of certain retained
interests associated with securitization transactions
outstanding at December 31, 2009. Fair value was determined
by discounting the expected future cash flows of these assets.
The sensitivity of these fair values to immediate 10% and 20%
adverse changes in key assumptions is also shown. These
changes are hypothetical. Changes in fair value based on a
10% variation in assumptions generally cannot be extrapolated
because the relationship of the change in the assumption to the
change in fair value may not be linear. Also, the effect of a
variation in a particular assumption on the fair value of the
retained interests is calculated without changing any other
assumption; in reality, changes in one factor may result in
changes in another (for example, increases in market interest
rates may result in lower prepayments and increased credit
losses), which might magnify or counteract the sensitivities.
Credit Card Loans
December 31, 2009
Dollars in millions
Fair
Value
Weighted-
Average
Life
(in months)
Variable
Annual
Coupon
Rate To
Investors
Monthly
Principal
Repayment
Rate
Expected
Annual
Credit
Losses
Annual
Discount
Rate Yield
Interest-only strip (a) $11.0 3.6 .45% 15.70% 7.29% 15.00% 12.10%
Decline in fair value:
10% adverse change $ .7 $ 3.2 $ 5.3
20% adverse change $ .3 $ 1.4 $ 6.5 $ 10.6
(a) Series 2005-1, 2006-1, 2007-1, and 2008-3.
December 31, 2008
Dollars in millions
Fair
Value
Weighted-
Average
Life
(in months)
Variable
Annual
Coupon
Rate To
Investors
Monthly
Principal
Repayment
Rate
Expected
Annual
Credit
Losses
Annual
Discount
Rate Yield
Interest-only strip (a) $19.6 3.3 1.19% 17.54% 5.18% 15.00% 12.55%
Decline in fair value:
10% adverse change $ .1 $ 1.4 $ 2.3 $ 5.4
20% adverse change $ .3 $ 2.6 $ 4.7 $ 10.8
(a) Series 2005-1, 2006-1, 2007-1, 2008-1, 2008-2, and 2008-3.
131