PNC Bank 2009 Annual Report Download - page 34
Download and view the complete annual report
Please find page 34 of the 2009 PNC Bank annual report below. You can navigate through the pages in the report by either clicking on the pages listed below, or by using the keyword search tool below to find specific information within the annual report.-
 1
1 -
2
-
3
-
4
-
5
-
6
-
7
-
8
-
9
-
10
-
11
-
12
-
13
-
14
-
15
-
16
-
17
-
18
-
19
-
20
-
21
-
22
-
23
-
 24
24 -
 25
25 -
 26
26 -
 27
27 -
 28
28 -
 29
29 -
 30
30 -
 31
31 -
 32
32 -
 33
33 -
 34
34 -
 35
35 -
 36
36 -
 37
37 -
 38
38 -
 39
39 -
 40
40 -
 41
41 -
 42
42 -
 43
43 -
 44
44 -
45
-
46
-
47
-
48
-
49
-
50
-
51
-
52
-
53
-
54
-
55
-
56
-
57
-
58
-
59
-
60
-
61
-
62
-
63
-
64
-
65
-
66
-
67
-
68
-
69
-
70
-
71
-
72
-
73
-
74
-
75
-
76
-
77
-
78
-
79
-
80
-
81
-
82
-
83
-
84
-
85
-
86
-
87
-
88
-
89
-
90
-
91
-
92
-
93
-
94
-
95
-
96
-
97
-
98
-
99
-
100
-
101
-
102
-
103
-
104
-
105
-
106
-
107
-
108
-
109
-
110
-
111
-
112
-
113
-
114
-
115
-
116
-
117
-
118
-
119
-
120
-
121
-
122
-
123
-
124
-
125
-
126
-
127
-
128
-
129
-
130
-
131
-
132
-
133
-
134
-
135
-
136
-
137
-
138
-
139
-
140
-
141
-
142
-
143
-
144
-
145
-
146
-
147
-
148
-
149
-
150
-
151
-
152
-
153
-
154
-
155
-
156
-
157
-
158
-
159
-
160
-
161
-
162
-
163
-
164
-
165
-
166
-
167
-
168
-
169
-
170
-
171
-
172
-
173
-
174
-
175
-
176
-
177
-
178
-
179
-
180
-
181
-
182
-
183
-
184
-
185
-
186
-
187
-
188
-
189
-
190
-
191
-
192
-
193
-
194
-
195
-
196
 |
 |

C
ONSOLIDATED
B
ALANCE
S
HEET
R
EVIEW
S
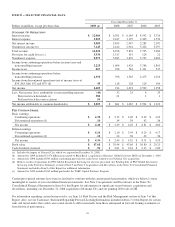
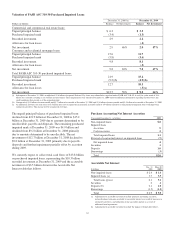
UMMARIZED
B
ALANCE
S
HEET
D
ATA
In millions
Dec. 31
2009
Dec. 31
2008
Assets
Loans $157,543 $175,489
Investment securities 56,027 43,473
Cash and short-term investments 13,290 22,911
Loans held for sale 2,539 4,366
Goodwill and other intangible assets 12,909 11,688
Equity investments 10,254 8,554
Other 17,301 24,600
Total assets $269,863 $291,081
Liabilities
Deposits $186,922 $192,865
Borrowed funds 39,261 52,240
Other 11,113 18,328
Total liabilities 237,296 263,433
Total shareholders’ equity 29,942 25,422
Noncontrolling interests 2,625 2,226
Total equity 32,567 27,648
Total liabilities and equity $269,863 $291,081
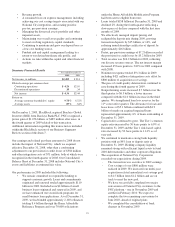
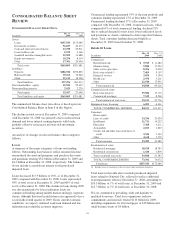
The summarized balance sheet data above is based upon our
Consolidated Balance Sheet in Item 8 of this Report.
The decline in total assets at December 31, 2009 compared
with December 31, 2008 was primarily due to reduced loan
demand and lower interest-earning deposits with banks,
partially offset by an increase in lower risk investment
securities.
An analysis of changes in selected balance sheet categories
follows.
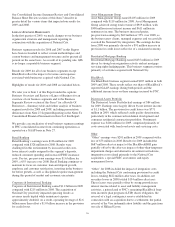
L
OANS
A summary of the major categories of loans outstanding
follows. Outstanding loan balances reflect unearned income,
unamortized discount and premium, and purchase discounts
and premiums totaling $3.2 billion at December 31, 2009 and
$4.3 billion at December 31, 2008, respectively. The balances
do not include accretable net interest on the purchased
impaired loans.
Loans decreased $17.9 billion, or 10%, as of December 31,
2009 compared with December 31, 2008. Loans represented
58% of total assets at December 31, 2009 and 60% of total
assets at December 31, 2008. The decline in loans during 2009
was driven primarily by lower utilization levels for
commercial lending among middle market and large corporate
clients, although this trend in utilization rates appeared to have
eased in the fourth quarter of 2009. Given current economic
conditions, we expect continued weak loan demand and low
utilization rates until the economy improves.
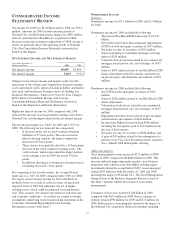
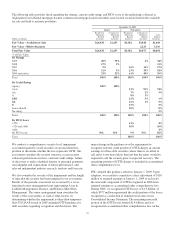
Commercial lending represented 53% of the loan portfolio and
consumer lending represented 47% at December 31, 2009.
Commercial lending declined 17% at December 31, 2009
compared with December 31, 2008. Commercial loans, which
comprised 65% of total commercial lending, declined 21%
due to reduced demand for new loans, lower utilization levels
and paydowns as clients continued to deleverage their balance
sheets. Total consumer lending decreased slightly at
December 31, 2009 from December 31, 2008.
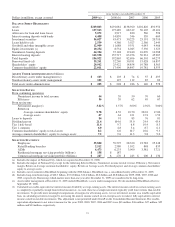
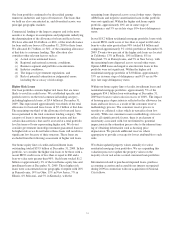
Details Of Loans
In millions
Dec. 31
2009
Dec. 31
2008
Commercial
Retail/wholesale $ 9,515 $ 11,482
Manufacturing 9,880 13,263
Other service providers 8,256 9,038
Real estate related (a) 7,403 9,107
Financial services 3,874 5,194
Health care 2,970 3,201
Other 12,920 17,935
Total commercial 54,818 69,220
Commercial real estate
Real estate projects 15,582 17,176
Commercial mortgage 7,549 8,560
Total commercial real estate 23,131 25,736
Equipment lease financing 6,202 6,461
TOTAL COMMERCIAL LENDING 84,151 101,417
Consumer
Home equity
Lines of credit 24,236 24,024
Installment 11,711 14,252
Education 7,468 4,211
Automobile 2,013 1,667
Credit card and other unsecured lines of
credit 3,536 3,163
Other 4,618 5,172
Total consumer 53,582 52,489
Residential real estate
Residential mortgage 18,190 18,783
Residential construction 1,620 2,800
Total residential real estate 19,810 21,583
TOTAL CONSUMER LENDING 73,392 74,072
Total loans $157,543 $175,489
(a) Includes loans to customers in the real estate and construction industries.
Total loans in the table above include purchased impaired
loans related to National City, adjusted to reflect additional
loan impairments effective December 31, 2008, amounting to
$10.3 billion, or 7% of total loans, at December 31, 2009 and
$12.7 billion, or 7% of total loans, at December 31, 2008.
We are committed to providing credit and liquidity to
qualified borrowers. Total loan originations and new
commitments and renewals totaled $110 billion for 2009,
including originations for first mortgages of $19 billion and
small business loans of $4 billion.
30