PNC Bank 2009 Annual Report Download - page 52
Download and view the complete annual report
Please find page 52 of the 2009 PNC Bank annual report below. You can navigate through the pages in the report by either clicking on the pages listed below, or by using the keyword search tool below to find specific information within the annual report.-
 1
1 -
2
-
3
-
4
-
5
-
6
-
7
-
8
-
9
-
10
-
11
-
12
-
13
-
14
-
15
-
16
-
17
-
18
-
19
-
20
-
21
-
22
-
23
-
24
-
25
-
26
-
27
-
28
-
29
-
30
-
31
-
32
-
33
-
34
-
35
-
36
-
37
-
38
-
39
-
40
-
41
-
 42
42 -
 43
43 -
 44
44 -
 45
45 -
 46
46 -
 47
47 -
 48
48 -
 49
49 -
 50
50 -
 51
51 -
 52
52 -
 53
53 -
 54
54 -
 55
55 -
 56
56 -
 57
57 -
 58
58 -
 59
59 -
 60
60 -
 61
61 -
 62
62 -
63
-
64
-
65
-
66
-
67
-
68
-
69
-
70
-
71
-
72
-
73
-
74
-
75
-
76
-
77
-
78
-
79
-
80
-
81
-
82
-
83
-
84
-
85
-
86
-
87
-
88
-
89
-
90
-
91
-
92
-
93
-
94
-
95
-
96
-
97
-
98
-
99
-
100
-
101
-
102
-
103
-
104
-
105
-
106
-
107
-
108
-
109
-
110
-
111
-
112
-
113
-
114
-
115
-
116
-
117
-
118
-
119
-
120
-
121
-
122
-
123
-
124
-
125
-
126
-
127
-
128
-
129
-
130
-
131
-
132
-
133
-
134
-
135
-
136
-
137
-
138
-
139
-
140
-
141
-
142
-
143
-
144
-
145
-
146
-
147
-
148
-
149
-
150
-
151
-
152
-
153
-
154
-
155
-
156
-
157
-
158
-
159
-
160
-
161
-
162
-
163
-
164
-
165
-
166
-
167
-
168
-
169
-
170
-
171
-
172
-
173
-
174
-
175
-
176
-
177
-
178
-
179
-
180
-
181
-
182
-
183
-
184
-
185
-
186
-
187
-
188
-
189
-
190
-
191
-
192
-
193
-
194
-
195
-
196
 |
 |

B
USINESS
S
EGMENTS
R
EVIEW
In the first quarter of 2009, we made changes to our business
organization structure and management reporting in
conjunction with the acquisition of National City.
Business segment results for 2008 have been reclassified to
reflect current methodologies and current business and
management structure and to present prior periods on the same
basis. As a result of its pending sale, GIS is no longer a
reportable business segment.
Results for 2009 for all of our business segments except
BlackRock include revenues and expenses associated with
businesses acquired with National City.
Business segment results, including inter-segment revenues,
and a description of each business are included in Note 27
Segment Reporting included in the Notes To Consolidated
Financial Statements of this Report. Certain revenue and
expense amounts included in this Item 7 differ from the
amounts shown in Note 27 primarily due to the presentation in
this Item 7 of business net interest revenue on a taxable-
equivalent basis.
Results of individual businesses are presented based on our
management accounting practices and management structure.
There is no comprehensive, authoritative body of guidance for
management accounting equivalent to GAAP; therefore, the
financial results of our individual businesses are not
necessarily comparable with similar information for any other
company. We refine our methodologies from time to time as
our management accounting practices are enhanced and our
businesses and management structure change. We typically
update key cost allocation components annually. Certain prior
period amounts have been reclassified to reflect current
methodologies and our current business and management
structure. Financial results are presented, to the extent
practicable, as if each business operated on a stand-alone
basis. We have aggregated the business results for certain
similar operating segments for financial reporting purposes.
Assets receive a funding charge and liabilities and capital
receive a funding credit based on a transfer pricing
methodology that incorporates product maturities, duration
and other factors. Capital is intended to cover unexpected
losses and is assigned to the banking and servicing businesses
using our risk-based economic capital model. We have
assigned capital equal to 6% of funds to Retail Banking to
approximate market comparables for this business.
We have allocated the allowances for loan and lease losses
and unfunded loan commitments and letters of credit based on
our assessment of risk inherent in the business segment loan
portfolios. Our allocation of the costs incurred by operations
and other shared support areas not directly aligned with the
businesses is primarily based on the use of services.
Total business segment financial results differ from
consolidated results from continuing operations. The impact
of these differences is reflected in the “Other” category.
“Other” for purposes of this Business Segments Review and
the Business Segment Highlights in the Executive Summary
includes residual activities that do not meet the criteria for
disclosure as a separate reportable business, such as gains or
losses related to BlackRock transactions including LTIP share
distributions and obligations, earnings and gains related to
Hilliard Lyons for the first quarter of 2008, integration costs,
asset and liability management activities including net
securities gains or losses and certain trading activities, exited
businesses, equity management activities, tax credit
investments, alternative investments, intercompany
eliminations, most corporate overhead, and differences
between business segment performance reporting and
financial statement reporting (GAAP), including the
presentation of net income attributable to noncontrolling
interests.
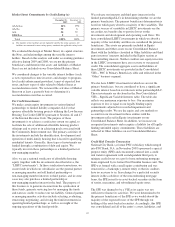
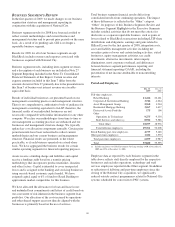
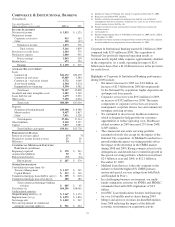
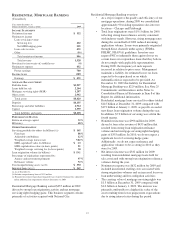
Period-end Employees
Dec. 31
2009
Dec. 31
2008
Full-time employees
Retail Banking 21,416 22,461
Corporate & Institutional Banking 3,746 4,264
Asset Management Group 2,960 3,204
Residential Mortgage Banking 3,267 3,637
Distressed Assets Portfolio 175 106
Other
Operations & Technology 9,275 9,350
Staff Services and other (a) 8,922 9,586
Total Other 18,197 18,936
Total full-time employees 49,761 52,608
Retail Banking part-time employees 4,737 5,448
Other part-time employees 1,322 1,539
Total part-time employees 6,059 6,987
Total 55,820 59,595
(a) Includes employees of Global Investment Servicing totaling 4,450 at December 31,
2009 and 4,934 at December 31, 2008.
Employee data as reported by each business segment in the
table above reflects staff directly employed by the respective
businesses and excludes operations, technology and staff
services employees reported in the Other segment. In addition
to reductions of full-time and part-time employees since the
closing of the National City acquisition, we significantly
reduced outside contract programmers related to National City
systems scheduled for conversion to PNC systems.
48