PNC Bank 2009 Annual Report Download - page 63
Download and view the complete annual report
Please find page 63 of the 2009 PNC Bank annual report below. You can navigate through the pages in the report by either clicking on the pages listed below, or by using the keyword search tool below to find specific information within the annual report.-
 1
1 -
2
-
3
-
4
-
5
-
6
-
7
-
8
-
9
-
10
-
11
-
12
-
13
-
14
-
15
-
16
-
17
-
18
-
19
-
20
-
21
-
22
-
23
-
24
-
25
-
26
-
27
-
28
-
29
-
30
-
31
-
32
-
33
-
34
-
35
-
36
-
37
-
38
-
39
-
40
-
41
-
42
-
43
-
44
-
45
-
46
-
47
-
48
-
49
-
50
-
51
-
52
-
 53
53 -
 54
54 -
 55
55 -
 56
56 -
 57
57 -
 58
58 -
 59
59 -
 60
60 -
 61
61 -
 62
62 -
 63
63 -
 64
64 -
 65
65 -
 66
66 -
 67
67 -
 68
68 -
 69
69 -
 70
70 -
 71
71 -
 72
72 -
 73
73 -
74
-
75
-
76
-
77
-
78
-
79
-
80
-
81
-
82
-
83
-
84
-
85
-
86
-
87
-
88
-
89
-
90
-
91
-
92
-
93
-
94
-
95
-
96
-
97
-
98
-
99
-
100
-
101
-
102
-
103
-
104
-
105
-
106
-
107
-
108
-
109
-
110
-
111
-
112
-
113
-
114
-
115
-
116
-
117
-
118
-
119
-
120
-
121
-
122
-
123
-
124
-
125
-
126
-
127
-
128
-
129
-
130
-
131
-
132
-
133
-
134
-
135
-
136
-
137
-
138
-
139
-
140
-
141
-
142
-
143
-
144
-
145
-
146
-
147
-
148
-
149
-
150
-
151
-
152
-
153
-
154
-
155
-
156
-
157
-
158
-
159
-
160
-
161
-
162
-
163
-
164
-
165
-
166
-
167
-
168
-
169
-
170
-
171
-
172
-
173
-
174
-
175
-
176
-
177
-
178
-
179
-
180
-
181
-
182
-
183
-
184
-
185
-
186
-
187
-
188
-
189
-
190
-
191
-
192
-
193
-
194
-
195
-
196
 |
 |

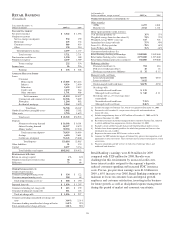
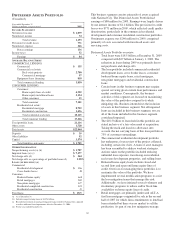
D
ISTRESSED
A
SSETS
P
ORTFOLIO
(Unaudited)
Year ended December 31
Dollars in millions, except as noted 2009
I
NCOME
S
TATEMENT
Net interest income $ 1,079
Noninterest income 74
Total revenue 1,153
Provision for credit losses 771
Noninterest expense 246
Pretax earnings 136
Income taxes 52
Earnings $84
A
VERAGE
B
ALANCE
S
HEET
COMMERCIAL LENDING:
Commercial $ 155
Commercial real estate
Real estate projects 2,780
Commercial mortgage 97
Equipment lease financing 818
Total commercial lending 3,850
CONSUMER LENDING:
Consumer:
Home equity lines of credit 4,952
Home equity installment loans 2,134
Other consumer 15
Total consumer 7,101
Residential real estate:
Residential mortgage 8,729
Residential construction 1,436
Total residential real estate 10,165
Total consumer lending 17,266
Total portfolio loans 21,116
Other assets 1,728
Total assets $22,844
Deposits $39
Other liabilities 92
Capital 1,574
Total liabilities and equity $ 1,705
O
THER
I
NFORMATION
Nonperforming assets (a) (b) $ 1,787
Impaired loans (a) (c) $ 7,577
Net charge-offs (d) $ 544
Net charge-offs as a percentage of portfolio loans (d) 2.58%
L
OANS
(
IN BILLIONS
) (a)
Commercial
Residential development $ 2.6
Cross-border leases .8
Consumer
Brokered home equity 6.4
Retail mortgages 5.2
Non-prime mortgages 1.7
Residential completed construction 1.3
Residential construction .5
Total loans $ 18.5
(a) As of December 31.
(b) Includes nonperforming loans of $1.456 billion.
(c) Recorded investment of purchased impaired loans related to National City, adjusted
to reflect additional loan impairments effective December 31, 2008.
(d) For the year ended December 31.
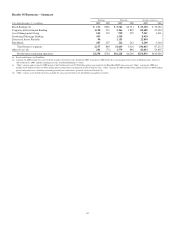
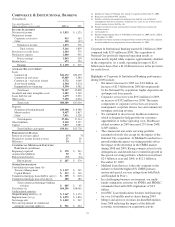
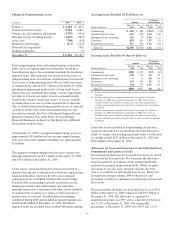
This business segment consists primarily of assets acquired
with National City. The Distressed Assets Portfolio had
earnings of $84 million for 2009. Earnings were largely driven
by net interest income of $1.1 billion. The provision for credit
losses was $771 million in 2009, which reflected credit quality
deterioration, particularly in the commercial residential
development and consumer residential construction portfolios.
Noninterest expense was $246 million for 2009, comprised
primarily of costs associated with foreclosed assets and
servicing costs.
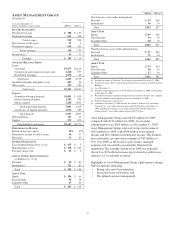
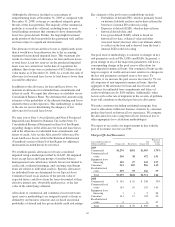
Distressed Assets Portfolio overview:
• Total loans were $18.5 billion at December 31, 2009
compared with $27 billion at January 1, 2009. The
reduction in loans during 2009 was primarily due to
net paydowns and charge-offs.
• The loan portfolio included commercial residential
development loans, cross border leases, consumer
brokered home equity loans, retail mortgages,
non-prime mortgages and residential construction
loans.
• Certain loans in this business segment may require
special servicing given current loan performance and
market conditions. Consequently, the business
activities of this segment are focused on maximizing
the value of the portfolios assigned to it while
mitigating risk. Business intent drives the inclusion
of assets in this business segment. Not all impaired
loans are included in this business segment, nor are
all of the loans included in this business segment
considered impaired.
• The $18.5 billion of loans held in this portfolio are
stated inclusive of a fair value mark at acquisition.
Taking the mark and loan loss allowance into
account, the net carrying basis of this loan portfolio is
75% of customer outstandings.
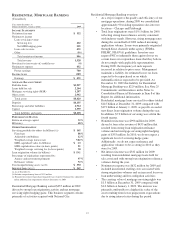
• The commercial residential development portfolio
has undergone a loan review of the project collateral,
including certain site visits. A team of asset managers
has been assembled to address workout strategies.
Actions taken on the portfolio included reducing
unfunded loan exposure, foreclosing on residential
real estate development properties, and selling loans.
• Brokered home equity loans include closed-end
second liens and open-end home equity lines of
credit. Our focus for managing these portfolios is to
maximize the value of the portfolio. We have
implemented several modification programs to assist
the loss mitigation teams that manage this risk.
Additionally, we have initiated several voluntary and
involuntary programs to reduce and/or block line
availability on home equity lines of credit.
• Retail mortgages are primarily jumbo and ALT-A
first lien mortgages originated for sale in the second
half of 2007 for which firm commitments to lend had
been extended but there was no market to sell the
production. As part of our loss mitigation strategy,
59