PNC Bank 2009 Annual Report Download - page 157
Download and view the complete annual report
Please find page 157 of the 2009 PNC Bank annual report below. You can navigate through the pages in the report by either clicking on the pages listed below, or by using the keyword search tool below to find specific information within the annual report.-
 1
1 -
2
-
3
-
4
-
5
-
6
-
7
-
8
-
9
-
10
-
11
-
12
-
13
-
14
-
15
-
16
-
17
-
18
-
19
-
20
-
21
-
22
-
23
-
24
-
25
-
26
-
27
-
28
-
29
-
30
-
31
-
32
-
33
-
34
-
35
-
36
-
37
-
38
-
39
-
40
-
41
-
42
-
43
-
44
-
45
-
46
-
47
-
48
-
49
-
50
-
51
-
52
-
53
-
54
-
55
-
56
-
57
-
58
-
59
-
60
-
61
-
62
-
63
-
64
-
65
-
66
-
67
-
68
-
69
-
70
-
71
-
72
-
73
-
74
-
75
-
76
-
77
-
78
-
79
-
80
-
81
-
82
-
83
-
84
-
85
-
86
-
87
-
88
-
89
-
90
-
91
-
92
-
93
-
94
-
95
-
96
-
97
-
98
-
99
-
100
-
101
-
102
-
103
-
104
-
105
-
106
-
107
-
108
-
109
-
110
-
111
-
112
-
113
-
114
-
115
-
116
-
117
-
118
-
119
-
120
-
121
-
122
-
123
-
124
-
125
-
126
-
127
-
128
-
129
-
130
-
131
-
132
-
133
-
134
-
135
-
136
-
137
-
138
-
139
-
140
-
141
-
142
-
143
-
144
-
145
-
146
-
 147
147 -
 148
148 -
 149
149 -
 150
150 -
 151
151 -
 152
152 -
 153
153 -
 154
154 -
 155
155 -
 156
156 -
 157
157 -
 158
158 -
 159
159 -
 160
160 -
 161
161 -
 162
162 -
 163
163 -
 164
164 -
 165
165 -
 166
166 -
 167
167 -
168
-
169
-
170
-
171
-
172
-
173
-
174
-
175
-
176
-
177
-
178
-
179
-
180
-
181
-
182
-
183
-
184
-
185
-
186
-
187
-
188
-
189
-
190
-
191
-
192
-
193
-
194
-
195
-
196
 |
 |

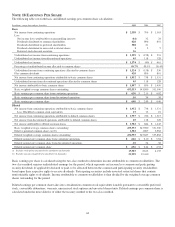
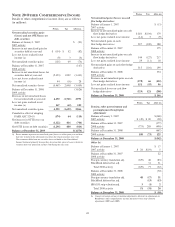
The accumulated balances related to each component of other
comprehensive income (loss) are as follows:
December 31 – in millions 2009 2008
Net unrealized securities losses $ (760) $(3,626)
OTTI losses on debt securities (816)
Net unrealized gains on cash flow hedge
derivatives 166 374
Pension, other postretirement and post
employment benefit plan adjustments (542) (667)
Other (10) (30)
Accumulated other comprehensive loss $(1,962) $(3,949)
N
OTE
21 I
NCOME
T
AXES
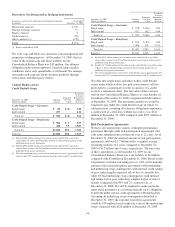
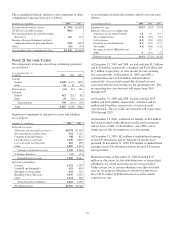
The components of income taxes from continuing operations
are as follows:
Year ended December 31
In millions 2009 2008 2007
Current
Federal $(109) $ 473 $409
State 46 61 52
Total current (63) 534 461
Deferred
Federal 912 (211) 82
State 18 (25) 18
Total deferred 930 (236) 100
Total $ 867 $ 298 $561
Significant components of deferred tax assets and liabilities
are as follows:
December 31 - in millions 2009 2008
Deferred tax assets
Allowance for loan and lease losses $1,978 $1,564
Net unrealized securities losses 922 2,121
Compensation and benefits 788 813
Unrealized losses on loans 1,349 1,825
Loss and credit carryforward 816 269
Other 1,287 1,672
Total gross deferred tax assets 7,140 8,264
Valuation allowance (31) (23)
Total deferred tax assets 7,109 8,241
Deferred tax liabilities
Leasing 1,191 1,292
Goodwill and Intangibles 619 636
Mortgage servicing rights 618 332
BlackRock basis difference 1,850 1,265
Other 1,124 968
Total deferred tax liabilities 5,402 4,493
Net deferred asset $1,707 $3,748
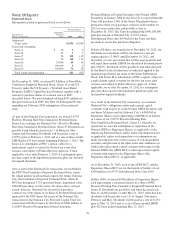
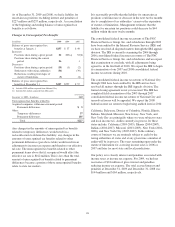
A reconciliation between the statutory and effective tax rates
follows:
Year ended December 31 2009 2008 2007
Statutory tax rate 35.0% 35.0% 35.0%
Increases (decreases) resulting from
State taxes net of federal benefit 1.2 2.3 2.3
Tax-exempt interest (1.2) (1.9) (.9)
Life insurance (1.9) (2.6) (1.8)
Dividend received deduction (1.2) (3.5) (1.7)
Tax credits (5.4) (4.8) (3.2)
Tax gain on sale of Hilliard Lyons 4.7
Other .4 (2.0) (.5)
Effective tax rate 26.9% 27.2% 29.2%
At December 31, 2009 and 2008, we had available $1.2 billion
and $124 million, respectively, of federal and $2.0 billion and
$1.7 billion, respectively, of state income tax net operating
loss carryforwards. At December 31, 2009 and 2008, a
valuation allowance of $31 million and $23 million,
respectively, was recorded against the deferred tax asset
associated with the state income tax net operating losses. The
net operating loss carryforwards will expire from 2010
through 2029.
At December 31, 2009 and 2008, we had available $254
million and $119 million, respectively, of federal and $4
million and $4 million, respectively, of state tax credit
carryforwards. The tax credit carryforwards will expire from
2010 through 2029.
At December 31, 2009, a deferred tax liability of $18 million
has been provided on the difference in the stock investment
and tax basis of GIS, a US subsidiary, since PNC can no
longer recover this investment in a tax-free manner.
At December 31, 2009, $62 million of undistributed earnings
of non-US subsidiaries had no deferred US income taxes
provided. At December 31, 2008, $59 million of undistributed
earnings of non-US subsidiaries had no deferred US income
taxes provided.
Retained earnings at December 31, 2009 included $117
million in allocations for bad debt deductions of former thrift
subsidiaries for which no income tax has been provided.
Under current law, if certain subsidiaries use these bad debt
reserves for purposes other than to absorb bad debt losses,
they will be subject to Federal income tax at the current
corporate tax rate.
153