PNC Bank 2009 Annual Report Download - page 112
Download and view the complete annual report
Please find page 112 of the 2009 PNC Bank annual report below. You can navigate through the pages in the report by either clicking on the pages listed below, or by using the keyword search tool below to find specific information within the annual report.-
 1
1 -
2
-
3
-
4
-
5
-
6
-
7
-
8
-
9
-
10
-
11
-
12
-
13
-
14
-
15
-
16
-
17
-
18
-
19
-
20
-
21
-
22
-
23
-
24
-
25
-
26
-
27
-
28
-
29
-
30
-
31
-
32
-
33
-
34
-
35
-
36
-
37
-
38
-
39
-
40
-
41
-
42
-
43
-
44
-
45
-
46
-
47
-
48
-
49
-
50
-
51
-
52
-
53
-
54
-
55
-
56
-
57
-
58
-
59
-
60
-
61
-
62
-
63
-
64
-
65
-
66
-
67
-
68
-
69
-
70
-
71
-
72
-
73
-
74
-
75
-
76
-
77
-
78
-
79
-
80
-
81
-
82
-
83
-
84
-
85
-
86
-
87
-
88
-
89
-
90
-
91
-
92
-
93
-
94
-
95
-
96
-
97
-
98
-
99
-
100
-
101
-
 102
102 -
 103
103 -
 104
104 -
 105
105 -
 106
106 -
 107
107 -
 108
108 -
 109
109 -
 110
110 -
 111
111 -
 112
112 -
 113
113 -
 114
114 -
 115
115 -
 116
116 -
 117
117 -
 118
118 -
 119
119 -
 120
120 -
 121
121 -
 122
122 -
123
-
124
-
125
-
126
-
127
-
128
-
129
-
130
-
131
-
132
-
133
-
134
-
135
-
136
-
137
-
138
-
139
-
140
-
141
-
142
-
143
-
144
-
145
-
146
-
147
-
148
-
149
-
150
-
151
-
152
-
153
-
154
-
155
-
156
-
157
-
158
-
159
-
160
-
161
-
162
-
163
-
164
-
165
-
166
-
167
-
168
-
169
-
170
-
171
-
172
-
173
-
174
-
175
-
176
-
177
-
178
-
179
-
180
-
181
-
182
-
183
-
184
-
185
-
186
-
187
-
188
-
189
-
190
-
191
-
192
-
193
-
194
-
195
-
196
 |
 |

dividend in connection with the implementation of a
shareholders’ rights plan, or the redemption or repurchase of
any rights under any such plan, (iv) as a result of an exchange
or conversion of any class or series of PNC’s capital stock for
any other class or series of PNC’s capital stock, (v) the
purchase of fractional interests in shares of PNC capital stock
pursuant to the conversion or exchange provisions of such
stock or the security being converted or exchanged or (vi) any
stock dividends paid by PNC where the dividend stock is the
same stock as that on which the dividend is being paid.
PNC Bank, N.A. has contractually committed to Trust I that if
full dividends are not paid in a dividend period on the Trust I
Securities, LLC Preferred Securities or any other parity equity
securities issued by the LLC, neither PNC Bank, N.A. nor its
subsidiaries will declare or pay dividends or other
distributions with respect to, or redeem, purchase or acquire or
make a liquidation payment with respect to, any of its equity
capital securities during the next succeeding period (other than
to holders of the LLC Preferred Securities and any parity
equity securities issued by the LLC) except: (i) in the case of
dividends payable to subsidiaries of PNC Bank, N.A., to PNC
Bank, N.A. or another wholly-owned subsidiary of PNC Bank,
N.A. or (ii) in the case of dividends payable to persons that are
not subsidiaries of PNC Bank, N.A., to such persons only if,
(A) in the case of a cash dividend, PNC has first irrevocably
committed to contribute amounts at least equal to such cash
dividend or (B) in the case of in-kind dividends payable by
PNC REIT Corp., PNC has committed to purchase such
in-kind dividend from the applicable PNC REIT Corp. holders
in exchange for a cash payment representing the market value
of such in-kind dividend, and PNC has committed to
contribute such in-kind dividend to PNC Bank, N.A.
N
OTE
4L
OANS
,C
OMMITMENTS TO
E
XTEND
C
REDIT AND
C
ONCENTRATIONS OF
C
REDIT
R
ISK
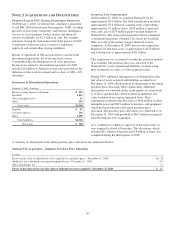
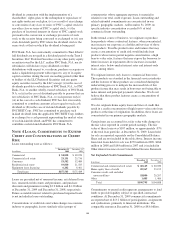
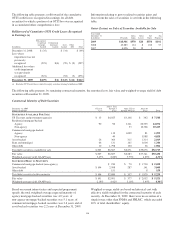
Loans outstanding were as follows:
In millions
December 31
2009
December 31
2008
Commercial $ 54,818 $ 69,220
Commercial real estate 23,131 25,736
Consumer 53,582 52,489
Residential real estate 19,810 21,583
Equipment lease financing 6,202 6,461
Total loans $157,543 $175,489
Loans are presented net of unearned income, net deferred loan
fees, unamortized discounts and premiums, and purchase
discounts and premiums totaling $3.2 billion and $4.3 billion
at December 31, 2009 and December 31, 2008, respectively.
Future accretable interest related to purchased impaired loans
is not included in loans outstanding.
Concentrations of credit risk exist when changes in economic,
industry or geographic factors similarly affect groups of
counterparties whose aggregate exposure is material in
relation to our total credit exposure. Loans outstanding and
related unfunded commitments are concentrated in our
primary geographic markets. At December 31, 2009, no
specific industry concentration exceeded 6% of total
commercial loans outstanding.
In the normal course of business, we originate or purchase
loan products whose contractual features, when concentrated,
may increase our exposure as a holder and servicer of those
loan products. Possible product terms and features that may
create a concentration of credit risk would include loan
products whose terms permit negative amortization, a high
loan-to-value ratio, features that may expose the borrower to
future increases in repayments above increases in market
interest rates, below-market interest rates and interest-only
loans, among others.
We originate interest-only loans to commercial borrowers.
These products are standard in the financial services industry
and the features of these products are considered during the
underwriting process to mitigate the increased risk of this
product feature that may result in borrowers not being able to
make interest and principal payments when due. We do not
believe that these product features create a concentration of
credit risk.
We also originate home equity loans and lines of credit that
result in a credit concentration of high loan-to-value ratio loan
products at the time of origination. In addition, these loans are
concentrated in our primary geographic markets.
Certain loans are accounted for at fair value with changes in
the fair value reported in current period earnings. The fair
value of these loans was $107 million, or approximately .07%
of the total loan portfolio, at December 31, 2009. Loans held
for sale are reported separately on the Consolidated Balance
Sheet and are not included in the table above. Interest income
from total loans held for sale was $270 million in 2009, $166
million in 2008 and $184 million in 2007 and is included in
Other interest income on our Consolidated Income Statement.
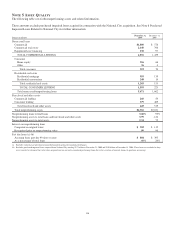
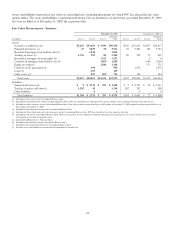
Net Unfunded Credit Commitments
In millions
December 31
2009
December 31
2008
Commercial and commercial real estate $ 60,143 $ 60,020
Home equity lines of credit 20,367 23,195
Consumer credit card and other
unsecured lines 18,800 20,207
Other 1,485 1,466
Total $100,795 $104,888
Commitments to extend credit represent arrangements to lend
funds or provide liquidity subject to specified contractual
conditions. At December 31, 2009 commercial commitments
are reported net of $13.2 billion of participations, assignments
and syndications, primarily to financial institutions. The
comparable amount at December 31, 2008 was $8.6 billion.
108