PNC Bank 2009 Annual Report Download - page 144
Download and view the complete annual report
Please find page 144 of the 2009 PNC Bank annual report below. You can navigate through the pages in the report by either clicking on the pages listed below, or by using the keyword search tool below to find specific information within the annual report.-
 1
1 -
2
-
3
-
4
-
5
-
6
-
7
-
8
-
9
-
10
-
11
-
12
-
13
-
14
-
15
-
16
-
17
-
18
-
19
-
20
-
21
-
22
-
23
-
24
-
25
-
26
-
27
-
28
-
29
-
30
-
31
-
32
-
33
-
34
-
35
-
36
-
37
-
38
-
39
-
40
-
41
-
42
-
43
-
44
-
45
-
46
-
47
-
48
-
49
-
50
-
51
-
52
-
53
-
54
-
55
-
56
-
57
-
58
-
59
-
60
-
61
-
62
-
63
-
64
-
65
-
66
-
67
-
68
-
69
-
70
-
71
-
72
-
73
-
74
-
75
-
76
-
77
-
78
-
79
-
80
-
81
-
82
-
83
-
84
-
85
-
86
-
87
-
88
-
89
-
90
-
91
-
92
-
93
-
94
-
95
-
96
-
97
-
98
-
99
-
100
-
101
-
102
-
103
-
104
-
105
-
106
-
107
-
108
-
109
-
110
-
111
-
112
-
113
-
114
-
115
-
116
-
117
-
118
-
119
-
120
-
121
-
122
-
123
-
124
-
125
-
126
-
127
-
128
-
129
-
130
-
131
-
132
-
133
-
 134
134 -
 135
135 -
 136
136 -
 137
137 -
 138
138 -
 139
139 -
 140
140 -
 141
141 -
 142
142 -
 143
143 -
 144
144 -
 145
145 -
 146
146 -
 147
147 -
 148
148 -
 149
149 -
 150
150 -
 151
151 -
 152
152 -
 153
153 -
 154
154 -
155
-
156
-
157
-
158
-
159
-
160
-
161
-
162
-
163
-
164
-
165
-
166
-
167
-
168
-
169
-
170
-
171
-
172
-
173
-
174
-
175
-
176
-
177
-
178
-
179
-
180
-
181
-
182
-
183
-
184
-
185
-
186
-
187
-
188
-
189
-
190
-
191
-
192
-
193
-
194
-
195
-
196
 |
 |

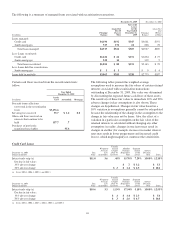
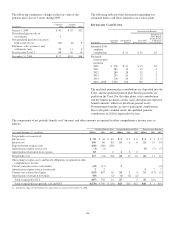
The following summarizes changes in the fair value of the
pension plan’s Level 3 assets during 2009:
In millions
Corporate
debt
Limited
partnerships Other
January 1, 2009 $ 41 $ 55 $12
Net realized gain on sale of
investments 2
Net unrealized gain/(loss) on assets
held at end of year (23) (6) 9
Purchases, sales, issuances, and
settlements (net) 29 11 9
Transfers into Level 3 68 59 14
December 31, 2009 $117 $119 $44
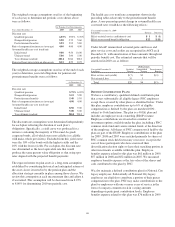
The following table provides information regarding our
estimated future cash flows related to our various plans:
E
STIMATED
C
ASH
F
LOWS
Postretirement Benefits
In millions
Qualified
Pension
Nonqualified
Pension
Gross PNC
Benefit Payments
Reduction in
PNC Benefit
Payments Due
to Medicare
Part D Subsidy
Estimated 2010
employer
contributions $ 31 $ 35 $2
Estimated
future benefit
payments
2010 $ 278 $ 31 $ 35 $2
2011 285 32 32 2
2012 289 28 32 2
2013 297 26 32 2
2014 304 24 32 2
2015 – 2019 1,555 102 150 7
The qualified pension plan contributions are deposited into the
Trust, and the qualified pension plan benefit payments are
paid from the Trust. For the other plans, total contributions
and the benefit payments are the same and represent expected
benefit amounts, which are paid from general assets.
Postretirement benefits are net of participant contributions.
Due to the plan’s funded status, the qualified pension
contribution in 2010 is expected to be zero.
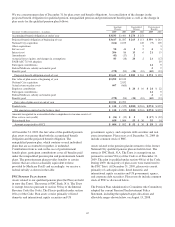
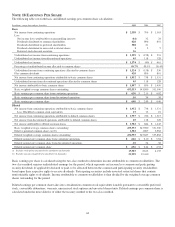
The components of net periodic benefit cost/ (income) and other amounts recognized in other comprehensive income were as
follows.
Qualified Pension Plan Nonqualified Pension Plan Postretirement Benefits
Year ended December 31 – in millions 2009(a) 2008 2007 2009(a) 2008 2007 2009(a) 2008 2007
Net periodic cost consists of:
Service cost $90 $44 $42 $2 $2 $2 $4 $3 $3
Interest cost 206 86 82 15 6621 15 14
Expected return on plan assets (260) (160) (156)
Amortization of prior service cost (2) (2) (5) (7) (7)
Amortization of actuarial losses (gains) 83 2122
Net periodic cost 117 (32) (30) 18 10 10 20 11 10
Other changes in plan assets and benefit obligations recognized in other
comprehensive income:
Current year prior service cost/(credit) (43) (17) 2(5)
Amortization of prior service (cost)/credit 22577
Current year actuarial loss/(gain) (263) 807 16 24 2421 (17) (2)
Amortization of actuarial (loss)/gain (83) (2) (1) (2) (2)
Total recognized in OCI (387) 792 14 25 226 (10)
Total recognized in net periodic cost and OCI $(270) $ 760 $ (16) $43 $10 $12 $46 $ 1 $10
(a) Includes the impact of the National City plans which we acquired on December 31, 2008.
140