PNC Bank 2009 Annual Report Download - page 80
Download and view the complete annual report
Please find page 80 of the 2009 PNC Bank annual report below. You can navigate through the pages in the report by either clicking on the pages listed below, or by using the keyword search tool below to find specific information within the annual report.-
 1
1 -
2
-
3
-
4
-
5
-
6
-
7
-
8
-
9
-
10
-
11
-
12
-
13
-
14
-
15
-
16
-
17
-
18
-
19
-
20
-
21
-
22
-
23
-
24
-
25
-
26
-
27
-
28
-
29
-
30
-
31
-
32
-
33
-
34
-
35
-
36
-
37
-
38
-
39
-
40
-
41
-
42
-
43
-
44
-
45
-
46
-
47
-
48
-
49
-
50
-
51
-
52
-
53
-
54
-
55
-
56
-
57
-
58
-
59
-
60
-
61
-
62
-
63
-
64
-
65
-
66
-
67
-
68
-
69
-
 70
70 -
 71
71 -
 72
72 -
 73
73 -
 74
74 -
 75
75 -
 76
76 -
 77
77 -
 78
78 -
 79
79 -
 80
80 -
 81
81 -
 82
82 -
 83
83 -
 84
84 -
 85
85 -
 86
86 -
 87
87 -
 88
88 -
 89
89 -
 90
90 -
91
-
92
-
93
-
94
-
95
-
96
-
97
-
98
-
99
-
100
-
101
-
102
-
103
-
104
-
105
-
106
-
107
-
108
-
109
-
110
-
111
-
112
-
113
-
114
-
115
-
116
-
117
-
118
-
119
-
120
-
121
-
122
-
123
-
124
-
125
-
126
-
127
-
128
-
129
-
130
-
131
-
132
-
133
-
134
-
135
-
136
-
137
-
138
-
139
-
140
-
141
-
142
-
143
-
144
-
145
-
146
-
147
-
148
-
149
-
150
-
151
-
152
-
153
-
154
-
155
-
156
-
157
-
158
-
159
-
160
-
161
-
162
-
163
-
164
-
165
-
166
-
167
-
168
-
169
-
170
-
171
-
172
-
173
-
174
-
175
-
176
-
177
-
178
-
179
-
180
-
181
-
182
-
183
-
184
-
185
-
186
-
187
-
188
-
189
-
190
-
191
-
192
-
193
-
194
-
195
-
196
 |
 |
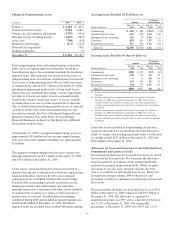
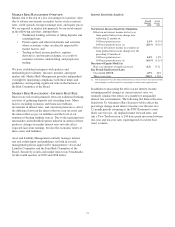
Trading revenue excludes the impact of economic hedging
activities, which related primarily to residential mortgage
servicing rights and residential and commercial real estate
loans.
Improved valuations resulted in better trading results in 2009
compared with 2008. Lower trading revenue in 2008 was
primarily related to our proprietary trading activities and
reflected the negative impact of a very illiquid market on the
assets that we held during the first quarter of 2008.
M
ARKET
R
ISK
M
ANAGEMENT
–E
QUITY
A
ND
O
THER
I
NVESTMENT
R
ISK
Equity investment risk is the risk of potential losses associated
with investing in both private and public equity markets. In
addition to extending credit, taking deposits, and underwriting
and trading financial instruments, we make and manage direct
investments in a variety of transactions, including
management buyouts, recapitalizations, and later-stage growth
financings in a variety of industries. We also have investments
in affiliated and non-affiliated funds that make similar
investments in private equity and in debt and equity-oriented
hedge funds. The economic and/or book value of these
investments and other assets such as loan servicing rights are
directly affected by changes in market factors.
The primary risk measurement for equity and other
investments is economic capital. Economic capital is a
common measure of risk for credit, market and operational
risk. It is an estimate of the worst-case value depreciation over
a one year horizon to a level commensurate with a financial
institution with an A rating by the credit rating agencies.
Given the illiquid nature of many of these types of
investments, it can be a challenge to determine their fair
values. Market Risk Management and Finance provide
independent oversight of the valuation process.
Various PNC business units manage our private equity and
other investment activities. Our businesses are responsible for
making investment decisions within the approved policy limits
and associated guidelines.
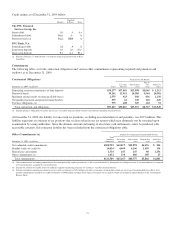
BlackRock
PNC owns approximately 44 million common stock
equivalent shares of BlackRock equity, accounted for under
the equity method. Our investment in BlackRock was $5.8
billion at December 31, 2009 compared with $4.2 billion at
December 31, 2008. The market value of our investment in
BlackRock was $10.1 billion at December 31, 2009. The
primary risk measurement, similar to other equity investments,
is economic capital.
The discussion of BlackRock within the Business Segments
Review section of this Item 7 includes information about
changes in our ownership structure of BlackRock during 2009
and BlackRock’s December 1, 2009 acquisition of BGI.
Tax Credit Investments
Included in our equity investments are tax credit investments.
These investments, as well as equity investments held by
consolidated partnerships, totaled $2.5 billion at December 31,
2009 and $2.3 billion at December 31, 2008. Investments
accounted for under the equity method totaled $2.0 billion
while investments accounted for under the cost method totaled
$488 million at December 31, 2009. The comparable amounts
at December 31, 2008 were $1.7 billion and $648 million.
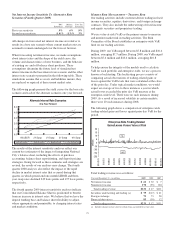
Visa
At December 31, 2009, our investment in Visa Class B
common shares totaled approximately 23 million shares.
Considering the adjustment to the conversion ratio due to
settled litigation reported by Visa, these shares would convert
to approximately 13.6 million of the publicly traded Visa
Class A common shares. As of December 31, 2009, we had
recognized $456 million of our Visa ownership, which we
acquired with National City, on our Consolidated Balance
Sheet. Based on the December 31, 2009 closing price of
$87.46 for the Visa shares the market value of our investment
was $1.2 billion. The Visa Class B common shares we own
generally will not be transferable, except under limited
circumstances, until they can be converted into shares of the
publicly traded class of stock, which cannot happen until the
later of three years after the IPO or settlement of all of the
specified litigation. It is expected that Visa will continue to
adjust the conversion ratio of Visa Class B to Class A shares
in connection with settlements in excess of any amounts then
in escrow for that purpose and will also reduce the conversion
ratio to the extent that it adds any funds to the escrow in the
future.
In July 2009, Visa funded $700 million to the litigation
escrow account and reduced the conversion ratio of Visa B to
A shares. We consequently recognized our estimated $66
million share of the $700 million as a reduction of our
indemnification liability and a reduction of noninterest
expense.
Note 25 Commitments and Guarantees in the Notes To
Consolidated Financial Statements in Item 8 of this Report has
further information on our Visa indemnification obligation.
Private Equity
The private equity portfolio is an illiquid portfolio comprised
of equity and mezzanine investments that vary by industry,
stage and type of investment. Private equity investments are
reported at fair value. Changes in the values of private equity
investments are reflected in our results of operations. Due to
the nature of the investments, the valuations incorporate
assumptions as to future performance, financial condition,
liquidity, availability of capital, and market conditions, among
other factors, to determine the estimated fair value of the
investments. Market conditions and actual performance of the
investments could differ from these assumptions.
76