PNC Bank 2009 Annual Report Download - page 77
Download and view the complete annual report
Please find page 77 of the 2009 PNC Bank annual report below. You can navigate through the pages in the report by either clicking on the pages listed below, or by using the keyword search tool below to find specific information within the annual report.-
 1
1 -
2
-
3
-
4
-
5
-
6
-
7
-
8
-
9
-
10
-
11
-
12
-
13
-
14
-
15
-
16
-
17
-
18
-
19
-
20
-
21
-
22
-
23
-
24
-
25
-
26
-
27
-
28
-
29
-
30
-
31
-
32
-
33
-
34
-
35
-
36
-
37
-
38
-
39
-
40
-
41
-
42
-
43
-
44
-
45
-
46
-
47
-
48
-
49
-
50
-
51
-
52
-
53
-
54
-
55
-
56
-
57
-
58
-
59
-
60
-
61
-
62
-
63
-
64
-
65
-
66
-
 67
67 -
 68
68 -
 69
69 -
 70
70 -
 71
71 -
 72
72 -
 73
73 -
 74
74 -
 75
75 -
 76
76 -
 77
77 -
 78
78 -
 79
79 -
 80
80 -
 81
81 -
 82
82 -
 83
83 -
 84
84 -
 85
85 -
 86
86 -
 87
87 -
88
-
89
-
90
-
91
-
92
-
93
-
94
-
95
-
96
-
97
-
98
-
99
-
100
-
101
-
102
-
103
-
104
-
105
-
106
-
107
-
108
-
109
-
110
-
111
-
112
-
113
-
114
-
115
-
116
-
117
-
118
-
119
-
120
-
121
-
122
-
123
-
124
-
125
-
126
-
127
-
128
-
129
-
130
-
131
-
132
-
133
-
134
-
135
-
136
-
137
-
138
-
139
-
140
-
141
-
142
-
143
-
144
-
145
-
146
-
147
-
148
-
149
-
150
-
151
-
152
-
153
-
154
-
155
-
156
-
157
-
158
-
159
-
160
-
161
-
162
-
163
-
164
-
165
-
166
-
167
-
168
-
169
-
170
-
171
-
172
-
173
-
174
-
175
-
176
-
177
-
178
-
179
-
180
-
181
-
182
-
183
-
184
-
185
-
186
-
187
-
188
-
189
-
190
-
191
-
192
-
193
-
194
-
195
-
196
 |
 |

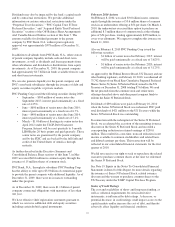
Credit ratings as of December 31, 2009 follow:
Moody’s
Standard
& Poor’s Fitch
The PNC Financial
Services Group, Inc.
Senior debt A3 A A+
Subordinated debt Baa1 A- A
Preferred stock (a) Baa2 BBB A
PNC Bank, N.A.
Subordinated debt A2 A A
Long-term deposits A1 A+ AA-
Short-term deposits P-1 A-1 F1+
(a) Effective February 17, 2010, Moody’s revised the rating on preferred stock to Baa3
from Baa2.
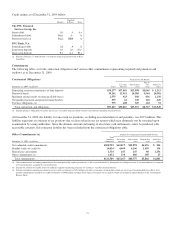
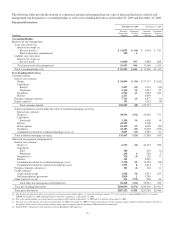
Commitments
The following tables set forth contractual obligations and various other commitments representing required and potential cash
outflows as of December 31, 2009.
Contractual Obligations Payment Due By Period
December 31, 2009 - in millions Total
Less than
one year
One to three
years
Four to
five
years
After five
years
Remaining contractual maturities of time deposits $54,277 $37,001 $13,998 $2,065 $ 1,213
Borrowed funds 39,261 12,951 10,385 5,544 10,381
Minimum annual rentals on noncancellable leases 2,575 423 560 436 1,156
Nonqualified pension and postretirement benefits 539 64 120 110 245
Purchase obligations (a) 975 428 329 164 54
Total contractual cash obligations $97,627 $50,867 $25,392 $8,319 $13,049
(a) Includes purchase obligations for goods and services covered by noncancellable contracts and contracts including cancellation fees.
At December 31, 2009, the liability for uncertain tax positions, excluding associated interest and penalties, was $227 million. This
liability represents an estimate of tax positions that we have taken in our tax returns which may ultimately not be sustained upon
examination by taxing authorities. Since the ultimate amount and timing of any future cash settlements cannot be predicted with
reasonable certainty, this estimated liability has been excluded from the contractual obligations table.
Other Commitments (a) Amount Of Commitment Expiration By Period
December 31, 2009 - in millions
Total
Amounts
Committed
Less than
one year
One to three
years
Four to five
years
After five
years
Net unfunded credit commitments $100,795 $60,017 $35,878 $4,476 $ 424
Standby letters of credit (b) 10,026 4,669 4,166 1,055 136
Reinsurance agreements 1,736 147 247 86 1,256
Other commitments (c) 1,032 334 486 185 27
Total commitments $113,589 $65,167 $40,777 $5,802 $1,843
(a) Other commitments are funding commitments that could potentially require performance in the event of demands by third parties or contingent events. Loan commitments are reported
net of participations, assignments and syndications.
(b) Includes $6.1 billion of standby letters of credit that support remarketing programs for customers’ variable rate demand notes.
(c) Includes unfunded commitments related to private equity investments of $453 million and other investments of $66 million which are not on our Consolidated Balance Sheet. Also
includes commitments related to tax credit investments of $490 million and other direct equity investments of $23 million which are included in other liabilities on the Consolidated
Balance Sheet.
73