PNC Bank 2009 Annual Report Download - page 92
Download and view the complete annual report
Please find page 92 of the 2009 PNC Bank annual report below. You can navigate through the pages in the report by either clicking on the pages listed below, or by using the keyword search tool below to find specific information within the annual report.-
 1
1 -
2
-
3
-
4
-
5
-
6
-
7
-
8
-
9
-
10
-
11
-
12
-
13
-
14
-
15
-
16
-
17
-
18
-
19
-
20
-
21
-
22
-
23
-
24
-
25
-
26
-
27
-
28
-
29
-
30
-
31
-
32
-
33
-
34
-
35
-
36
-
37
-
38
-
39
-
40
-
41
-
42
-
43
-
44
-
45
-
46
-
47
-
48
-
49
-
50
-
51
-
52
-
53
-
54
-
55
-
56
-
57
-
58
-
59
-
60
-
61
-
62
-
63
-
64
-
65
-
66
-
67
-
68
-
69
-
70
-
71
-
72
-
73
-
74
-
75
-
76
-
77
-
78
-
79
-
80
-
81
-
 82
82 -
 83
83 -
 84
84 -
 85
85 -
 86
86 -
 87
87 -
 88
88 -
 89
89 -
 90
90 -
 91
91 -
 92
92 -
 93
93 -
 94
94 -
 95
95 -
 96
96 -
 97
97 -
 98
98 -
 99
99 -
 100
100 -
 101
101 -
 102
102 -
103
-
104
-
105
-
106
-
107
-
108
-
109
-
110
-
111
-
112
-
113
-
114
-
115
-
116
-
117
-
118
-
119
-
120
-
121
-
122
-
123
-
124
-
125
-
126
-
127
-
128
-
129
-
130
-
131
-
132
-
133
-
134
-
135
-
136
-
137
-
138
-
139
-
140
-
141
-
142
-
143
-
144
-
145
-
146
-
147
-
148
-
149
-
150
-
151
-
152
-
153
-
154
-
155
-
156
-
157
-
158
-
159
-
160
-
161
-
162
-
163
-
164
-
165
-
166
-
167
-
168
-
169
-
170
-
171
-
172
-
173
-
174
-
175
-
176
-
177
-
178
-
179
-
180
-
181
-
182
-
183
-
184
-
185
-
186
-
187
-
188
-
189
-
190
-
191
-
192
-
193
-
194
-
195
-
196
 |
 |

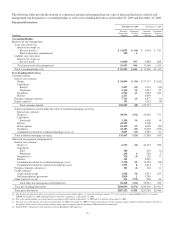
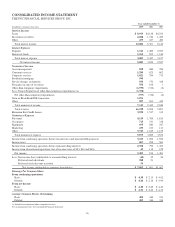
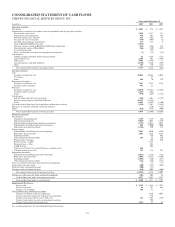
CONSOLIDATED INCOME STATEMENT
THE PNC FINANCIAL SERVICES GROUP, INC.
Year ended December 31
In millions, except per share data 2009 2008 2007
Interest Income
Loans $ 8,919 $4,138 $4,232
Investment securities 2,688 1,746 1,429
Other 479 417 483
Total interest income 12,086 6,301 6,144
Interest Expense
Deposits 1,741 1,485 2,053
Borrowed funds 1,262 962 1,144
Total interest expense 3,003 2,447 3,197
Net interest income 9,083 3,854 2,947
Noninterest Income
Asset management 858 686 784
Consumer services 1,290 623 692
Corporate services 1,021 704 713
Residential mortgage 990
Service charges on deposits 950 372 348
Net gains on sales of securities 550 106 1
Other-than-temporary impairments (1,935) (312) (6)
Less: Noncredit portion of other-than-temporary impairments (a) (1,358)
Net other-than-temporary impairments (577) (312) (6)
Gain on BlackRock/BGI transaction 1,076
Other 987 263 412
Total noninterest income 7,145 2,442 2,944
Total revenue 16,228 6,296 5,891
Provision For Credit Losses 3,930 1,517 315
Noninterest Expense
Personnel 4,119 1,766 1,815
Occupancy 713 331 318
Equipment 695 280 247
Marketing 233 123 113
Other 3,313 1,185 1,159
Total noninterest expense 9,073 3,685 3,652
Income from continuing operations before income taxes and noncontrolling interests 3,225 1,094 1,924
Income taxes 867 298 561
Income from continuing operations before noncontrolling interests 2,358 796 1,363
Income from discontinued operations (net of income taxes of $54, $63 and $66) 45 118 128
Net income 2,403 914 1,491
Less: Net income (loss) attributable to noncontrolling interests (44) 32 24
Preferred stock dividends 388 21
Preferred stock discount accretion 56
Net income attributable to common shareholders $ 2,003 $ 861 $1,467
Earnings Per Common Share
From continuing operations
Basic $ 4.30 $ 2.15 $ 4.02
Diluted $ 4.26 $ 2.10 $ 3.94
From net income
Basic $ 4.40 $ 2.49 $ 4.40
Diluted $ 4.36 $ 2.44 $ 4.32
Average Common Shares Outstanding
Basic 454 344 331
Diluted 455 346 334
(a) Included in accumulated other comprehensive loss.
See accompanying Notes To Consolidated Financial Statements.
88