PNC Bank 2009 Annual Report Download - page 31
Download and view the complete annual report
Please find page 31 of the 2009 PNC Bank annual report below. You can navigate through the pages in the report by either clicking on the pages listed below, or by using the keyword search tool below to find specific information within the annual report.-
 1
1 -
2
-
3
-
4
-
5
-
6
-
7
-
8
-
9
-
10
-
11
-
12
-
13
-
14
-
15
-
16
-
17
-
18
-
19
-
20
-
 21
21 -
 22
22 -
 23
23 -
 24
24 -
 25
25 -
 26
26 -
 27
27 -
 28
28 -
 29
29 -
 30
30 -
 31
31 -
 32
32 -
 33
33 -
 34
34 -
 35
35 -
 36
36 -
 37
37 -
 38
38 -
 39
39 -
 40
40 -
 41
41 -
42
-
43
-
44
-
45
-
46
-
47
-
48
-
49
-
50
-
51
-
52
-
53
-
54
-
55
-
56
-
57
-
58
-
59
-
60
-
61
-
62
-
63
-
64
-
65
-
66
-
67
-
68
-
69
-
70
-
71
-
72
-
73
-
74
-
75
-
76
-
77
-
78
-
79
-
80
-
81
-
82
-
83
-
84
-
85
-
86
-
87
-
88
-
89
-
90
-
91
-
92
-
93
-
94
-
95
-
96
-
97
-
98
-
99
-
100
-
101
-
102
-
103
-
104
-
105
-
106
-
107
-
108
-
109
-
110
-
111
-
112
-
113
-
114
-
115
-
116
-
117
-
118
-
119
-
120
-
121
-
122
-
123
-
124
-
125
-
126
-
127
-
128
-
129
-
130
-
131
-
132
-
133
-
134
-
135
-
136
-
137
-
138
-
139
-
140
-
141
-
142
-
143
-
144
-
145
-
146
-
147
-
148
-
149
-
150
-
151
-
152
-
153
-
154
-
155
-
156
-
157
-
158
-
159
-
160
-
161
-
162
-
163
-
164
-
165
-
166
-
167
-
168
-
169
-
170
-
171
-
172
-
173
-
174
-
175
-
176
-
177
-
178
-
179
-
180
-
181
-
182
-
183
-
184
-
185
-
186
-
187
-
188
-
189
-
190
-
191
-
192
-
193
-
194
-
195
-
196
 |
 |

C
ONSOLIDATED
I
NCOME
S
TATEMENT
R
EVIEW
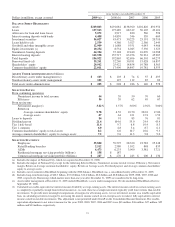
Net income for 2009 was $2.4 billion and for 2008 was $914
million. Amounts for 2009 include operating results of
National City and the fourth quarter impact of a $687 million
after-tax gain related to BlackRock’s acquisition of BGI.
Increases in income statement comparisons to 2008, except as
noted, are primarily due to the operating results of National
City. Our Consolidated Income Statement is presented in
Item 8 of this Report.
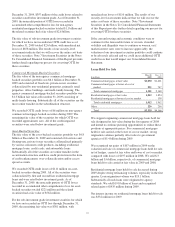
N
ET
I
NTEREST
I
NCOME AND
N
ET
I
NTEREST
M
ARGIN
Year ended December 31
Dollars in millions 2009 2008
Net interest income $9,083 $3,854
Net interest margin 3.82% 3.37%
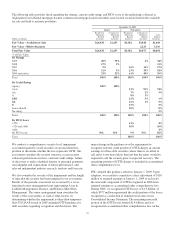
Changes in net interest income and margin result from the
interaction of the volume and composition of interest-earning
assets and related yields, interest-bearing liabilities and related
rates paid, and noninterest-bearing sources of funding. See
Statistical Information – Analysis Of Year-To-Year Changes
In Net Interest (Unaudited) Income And Average
Consolidated Balance Sheet and Net Interest Analysis in
Item 8 of this Report for additional information.
Higher net interest income for 2009 compared with 2008
reflected the increase in average interest-earning assets due to
National City and the improvement in the net interest margin.
The net interest margin was 3.82% for 2009 and 3.37% for
2008. The following factors impacted the comparison:
• A decrease in the rate accrued on interest-bearing
liabilities of 97 basis points. The rate accrued on
interest-bearing deposits, the largest component,
decreased 107 basis points.
• These factors were partially offset by a 45 basis point
decrease in the yield on interest-earning assets. The
yield on loans, which represented the largest portion
of our earning assets in 2009, decreased 30 basis
points.
• In addition, the impact of noninterest-bearing sources
of funding decreased 7 basis points.
For comparing to the broader market, the average Federal
funds rate was .16% for 2009 compared with 1.94% for 2008.
We expect our net interest income for 2010 will likely be
modestly lower as a result of cash recoveries on purchased
impaired loans in 2009 and additional run-off of higher-
yielding assets, which could be mitigated by rising interest
rates. This assumes our current expectations for interest rates
and economic conditions – we include our current economic
assumptions underlying our forward-looking statements in the
Cautionary Statement Regarding Forward-Looking
Information section of this Item 7.
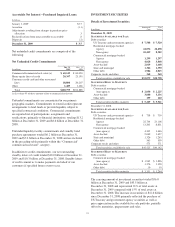
N
ONINTEREST
I
NCOME
Summary
Noninterest income was $7.1 billion for 2009 and $2.4 billion
for 2008.
Noninterest income for 2009 included the following:
• The gain on BlackRock/BGI transaction of $1.076
billion,
• Net credit-related other-than-temporary impairments
(OTTI) on debt and equity securities of $577 million,
• Net gains on sales of securities of $550 million,
• Gains on hedging of residential mortgage servicing
rights of $355 million,
• Valuation and sale income related to our commercial
mortgage loans held for sale, net of hedges, of $107
million,
• Gains of $103 million related to our BlackRock LTIP
shares adjustment in the first quarter, and net losses
on private equity and alternative investments of $93
million.
Noninterest income for 2008 included the following:
• Net OTTI on debt and equity securities of $312
million,
• Gains of $246 million related to our BlackRock LTIP
shares adjustment,
• Valuation and sale losses related to our commercial
mortgage loans held for sale, net of hedges, of $197
million,
• Impairment and other losses related to private equity
and alternative investments of $180 million,
• Income from Hilliard Lyons totaling $164 million,
including the first quarter gain of $114 million from
the sale of this business,
• Net gains on sales of securities of $106 million, and
• A gain of $95 million related to the redemption of a
portion of our Visa Class B common shares related to
Visa’s March 2008 initial public offering.
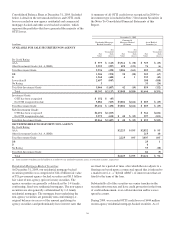
Additional analysis
Asset management revenue increased $172 million to $858
million in 2009, compared with $686 million in 2008. This
increase reflected improving equity markets, new business
generation and a shift in assets into higher yielding equity
investments during the second half of 2009. Assets managed
totaled $103 billion at both December 31, 2009 and 2008,
including the impact of National City. The Asset Management
Group section of the Business Segments Review section of
this Item 7 includes further discussion of assets under
management.
Consumer services fees totaled $1.290 billion in 2009
compared with $623 million in 2008. Service charges on
deposits totaled $950 million for 2009 and $372 million for
2008. Both increases were primarily driven by the impact of
the National City acquisition. Reduced consumer spending,
27